Entitlements And The Math Of Compounding
/In the prior post, I noted that the existing big federal entitlement programs (Social Security, Medicare, and Medicaid) consistently grow faster, year after year, than the overall rate of economic growth. In any given year, the growth of entitlement spending as a percent of GDP may seem small. But I concluded that:
[T]he United States . . . needs to figure out a way to get the entitlement spending into line with the size of the economy before the entitlements swallow the whole thing and completely impoverish the people.
This is a very slowly-growing problem, but very real. Again, understanding it is an exercise in math that is not very complicated.
Here’s how it plays out. Current spending on Social Security in just-ended fiscal year 2026 was about $1.5 trillion; spending on Medicare for the same period was about $1.3 trillion; and spending on Medicaid (federal share) was about $0.7 trillion. That’s a total of about $3.5 trillion for the three of them. The GDP for the entire economy was about $33 trillion. So the three entitlements consumed (via federal spending only) about 10.6% of the economy.
But every year each of the entitlements grows faster than the economy by about 1% to 3%. Considering the last 25 years since 2001, the compound annual growth rate of Social Security has been about 5.6%; the compound annual growth rate of Medicare has been about 7.6%; and the compound annual growth rate of federal Medicaid spending as been just under 7%. Meanwhile, the overall rate of economic growth of GDP has averaged about 4.6% over the same period (non-inflation adjusted). The rates of growth of the entitlements, and of GDP, obviously vary somewhat year by year. But the phenomenon that the entitlements grow on average by a couple of percent faster than GDP year after year is remarkably consistent.
With the magic of today’s AI, you can get yourself a graph of what happens if this just continues for decades without anyone trying to get the spending under control. Here is a graph produced for me by Google’s Gemini AI. The instructions were to plot two lines, one of which starts at 3.5 (current federal entitlement spending in trillions of dollars) and grows by 6.5% per annum, and the other of which starts at 33 (current GDP in trillions of dollars) and grows by 4.5% per annum.
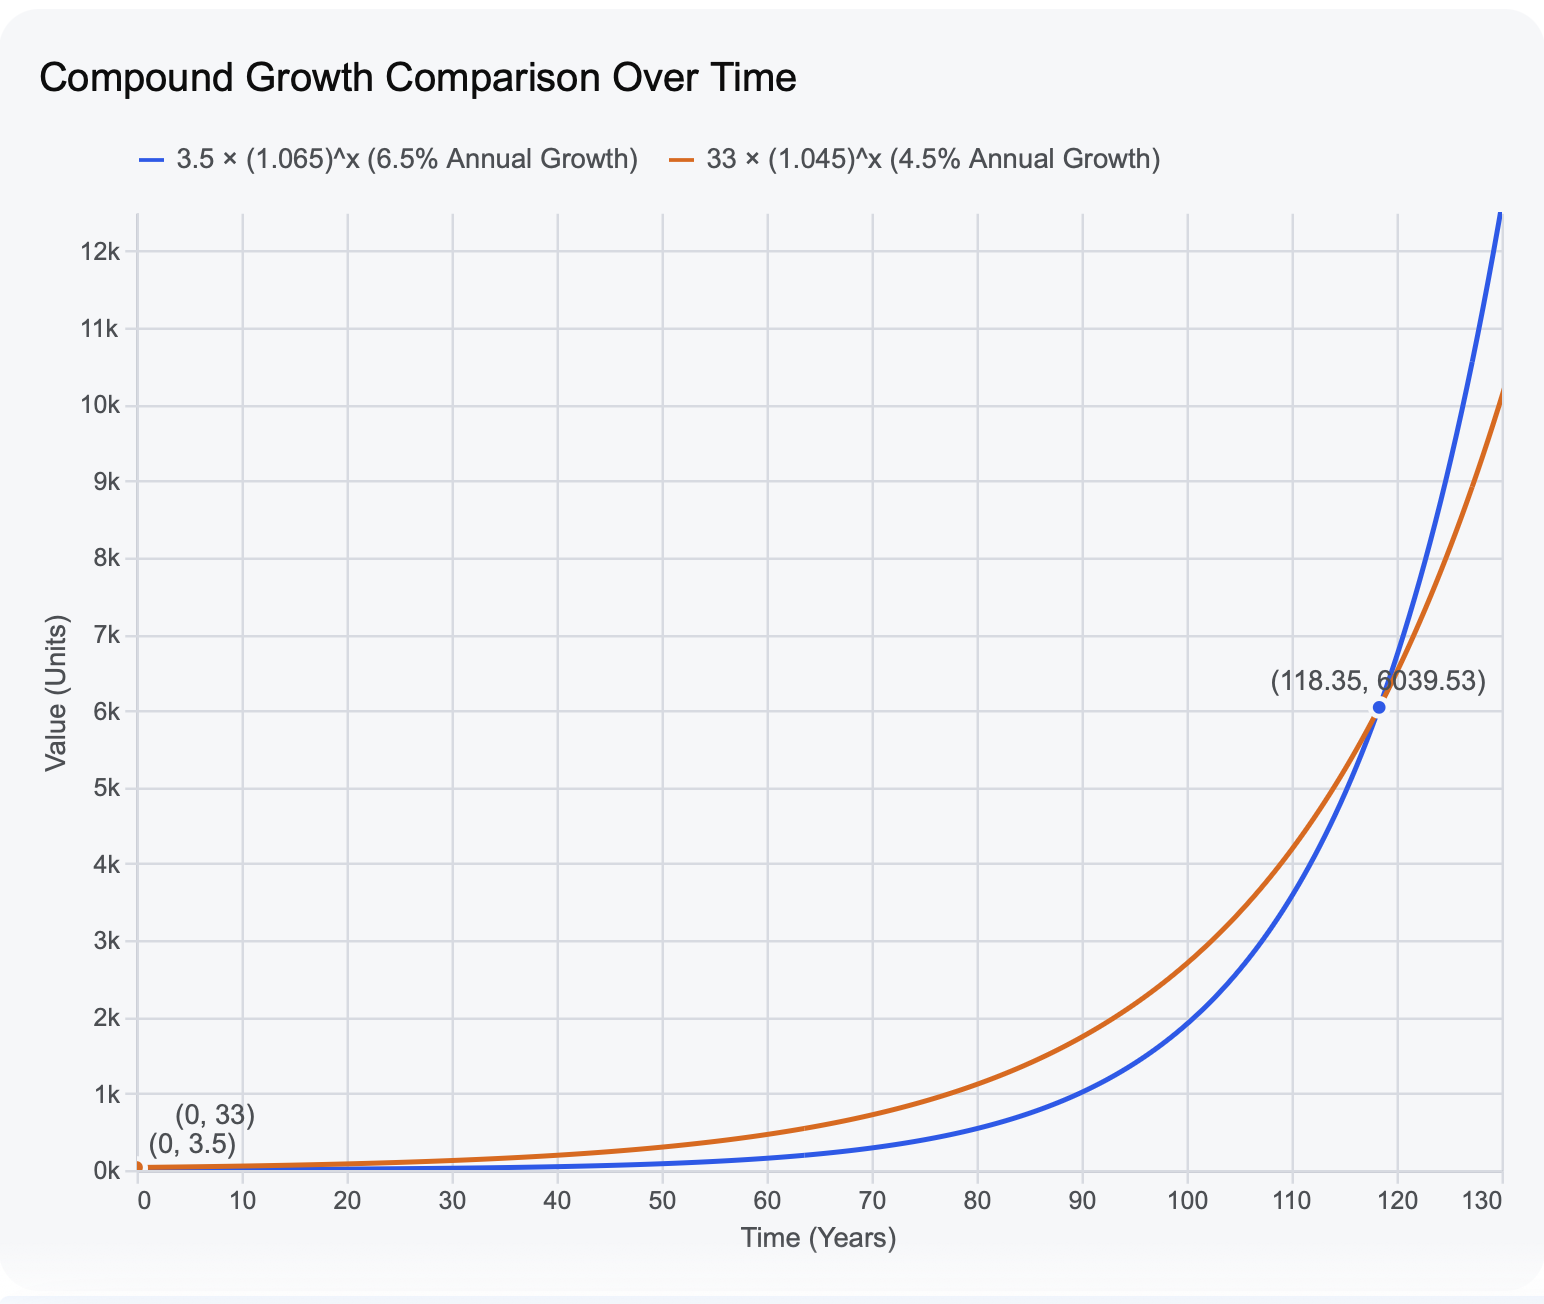
In the version of this generated on the Gemini website, you can hover your cursor over any point on the graph to get the values at that point. (You can also do the same calculation very easily with a basic calculator.) You find that 20 years out the economy has grown to about $80 trillion, while the entitlements have gone to about $13 trillion. So from today’s 10.6% of the economy, the entitlements have grown to about 16%. Forty years out, it’s $192 trillion for the economy, and $45 trillion for the entitlements — about 23.5%. At 60 years it’s $465 trillion for the economy, and $154 trillion for the entitlements — about 33%. And so forth. As the graph shows, the two lines meet at 118.35 years out, at which point the entitlements have swallowed the entire economy.
One conclusion from this is that there is really no prospect of being able to finance this kind of ongoing growth by imposing increasing taxes on a small slice of “billionaires,” or millionaires, or even a larger slice of upper middle income earners. That strategy might seem to cover the problem for the first few years or even a decade, but as you get into the second and third decade, the spending needs of the entitlements comes to exceed all the earnings of the upper income people, even if taxed at 100%.
Someone might push back against the assumptions behind this chart by contending that the rate of growth of the entitlements won’t continue past patterns, and will inevitably slow down. But why? Particularly in the area of the medical entitlements, the ongoing growth is driven by the combination of an aging population and the creativity of the people and the bureaucracy in adding covered items to the programs. Nursing home care, hospice, “adult day care,” non-emergency medical transportation (getting grandma to her doctors’ appointments), in-home aides (often family members) to do cooking and housecleaning, autism counseling, etc., etc., etc. How about vision and dental? (AOC wants to add those to Medicare coverage.). Medicaid for people with income below the poverty rate? How about double the poverty rate? How about four times? Why stop there? Pharmaceutical companies continually come up with new and creative drugs, always priced at high levels when they first come to market. Who is going to say no to paying for these things, and the many others like them coming down the pike?
And then of course we have Medicare for All. Its characteristerics are not yet known, but we will soon be learning as the new Democratic Congress puts its proposals in writing.
A very slowly-unfolding train wreck is coming for us all.