The Greatest Scientific Fraud Of All Time -- Part XXXII (Sea Level Rise Edition)
/The Greatest Scientific Fraud Of All Time is the fraud by which government functionaries alter data collected and previously reported in official data bases in order to support a narrative of impending catastrophic global warming. No other scientific fraud in world history comes close to this one in scope or significance. While prior frauds may have scored a crooked scientist some funding or maybe some temporary fame, this one drives trillions of dollars of worldwide government spending and seeks to transform the entire world economy. The prior 31 posts in this series are all collected for your reading enjoyment at this link. (They are in groups of six posts each, beginning with the most recent. After each six, you must go to the bottom and click the “NEXT” button to get the next six posts.)
Those prior 31 posts have all concerned alteration of one particular sort of data, namely temperature records. The posts document how, at station after station, previously-reported data have been altered to make earlier temperatures cooler and later ones warmer, and thus to show an enhanced warming trend (or in many cases to replace a cooling trend with a warming trend). The altered temperatures then form the basis for hockey-stick shaped charts of world temperatures, showing rapid recent warming, and for claims from NASA and NOAA and the media that the most recent year or month was the “warmest ever.”
But why should we really care that the earth’s atmosphere is getting a little warmer? The UN has supposedly set some kind of Maginot Line at a 1.5 deg C temperature increase from 20th century levels — an amount so small that you can barely feel it when it occurs each day. The 1.5 deg mark is just not that all that scary. So the bureaucrats and leftists need a Plan B to scare the bejeezus out of the people. Plan B is sea level rise.
So don’t be surprised to learn that the sea level data, produced by NASA, have recently been altered — and of course, in a way to enhance the global warming scare narrative.
With a little looking you can quickly find hundreds of articles endlessly repeating the narrative that human-caused global warming is melting polar ice caps and thus causing the sea level to rise. But note that for this narrative to be effective requires more than just a linear rising. After all, skeptics quickly point out that the sea level has been rising at a slow, steady rate of a few millimeters per year since the end of the last ice age. So, to actually be scary, the narrative needs to be that sea level is not just rising, but that the rise is accelerating.
Sure enough, that is the party line. Thus here from the NASA website posted in November 2022 and still there today, we find a statement of the official position:
Global sea level has been rising for decades in response to a warming climate, and multiple lines of evidence indicate the rise is accelerating. The new findings support the higher-range scenarios outlined in an interagency report released in February 2022. That report, developed by several federal agencies – including NASA, the National Oceanic and Atmospheric Administration (NOAA), and the U.S. Geological Survey – expect significant sea level rise over the next 30 years by region. . . . The researchers noted that the accelerating rate of sea level rise detected in satellite measurements from 1993 to 2020 – and the direction of those trends – suggest future sea level rise will be in the higher range of estimates for all regions.
NASA is the guru of the sea level rise data because, starting in 1993, NASA put up satellites with altimeters to measure sea level. The data have been made public on a NASA web page, and various researchers have gone through the data looking for trends. Some have claimed to find an acceleration in sea level rise. For example, a 2018 article in PNAS by Nerem, et al., titled “Climate-change-driven accelerated sea-level rise detected in the altimeter era” asserted that the authors had detected an acceleration of 0.084 +/- 0.025 mm/yr^2. But is that purported acceleration real and, if real, is it significant?
And no effort to scare you about sea level rise would be complete without a picture of some coastal community under water. So they provide this one from Norfolk, Virginia:
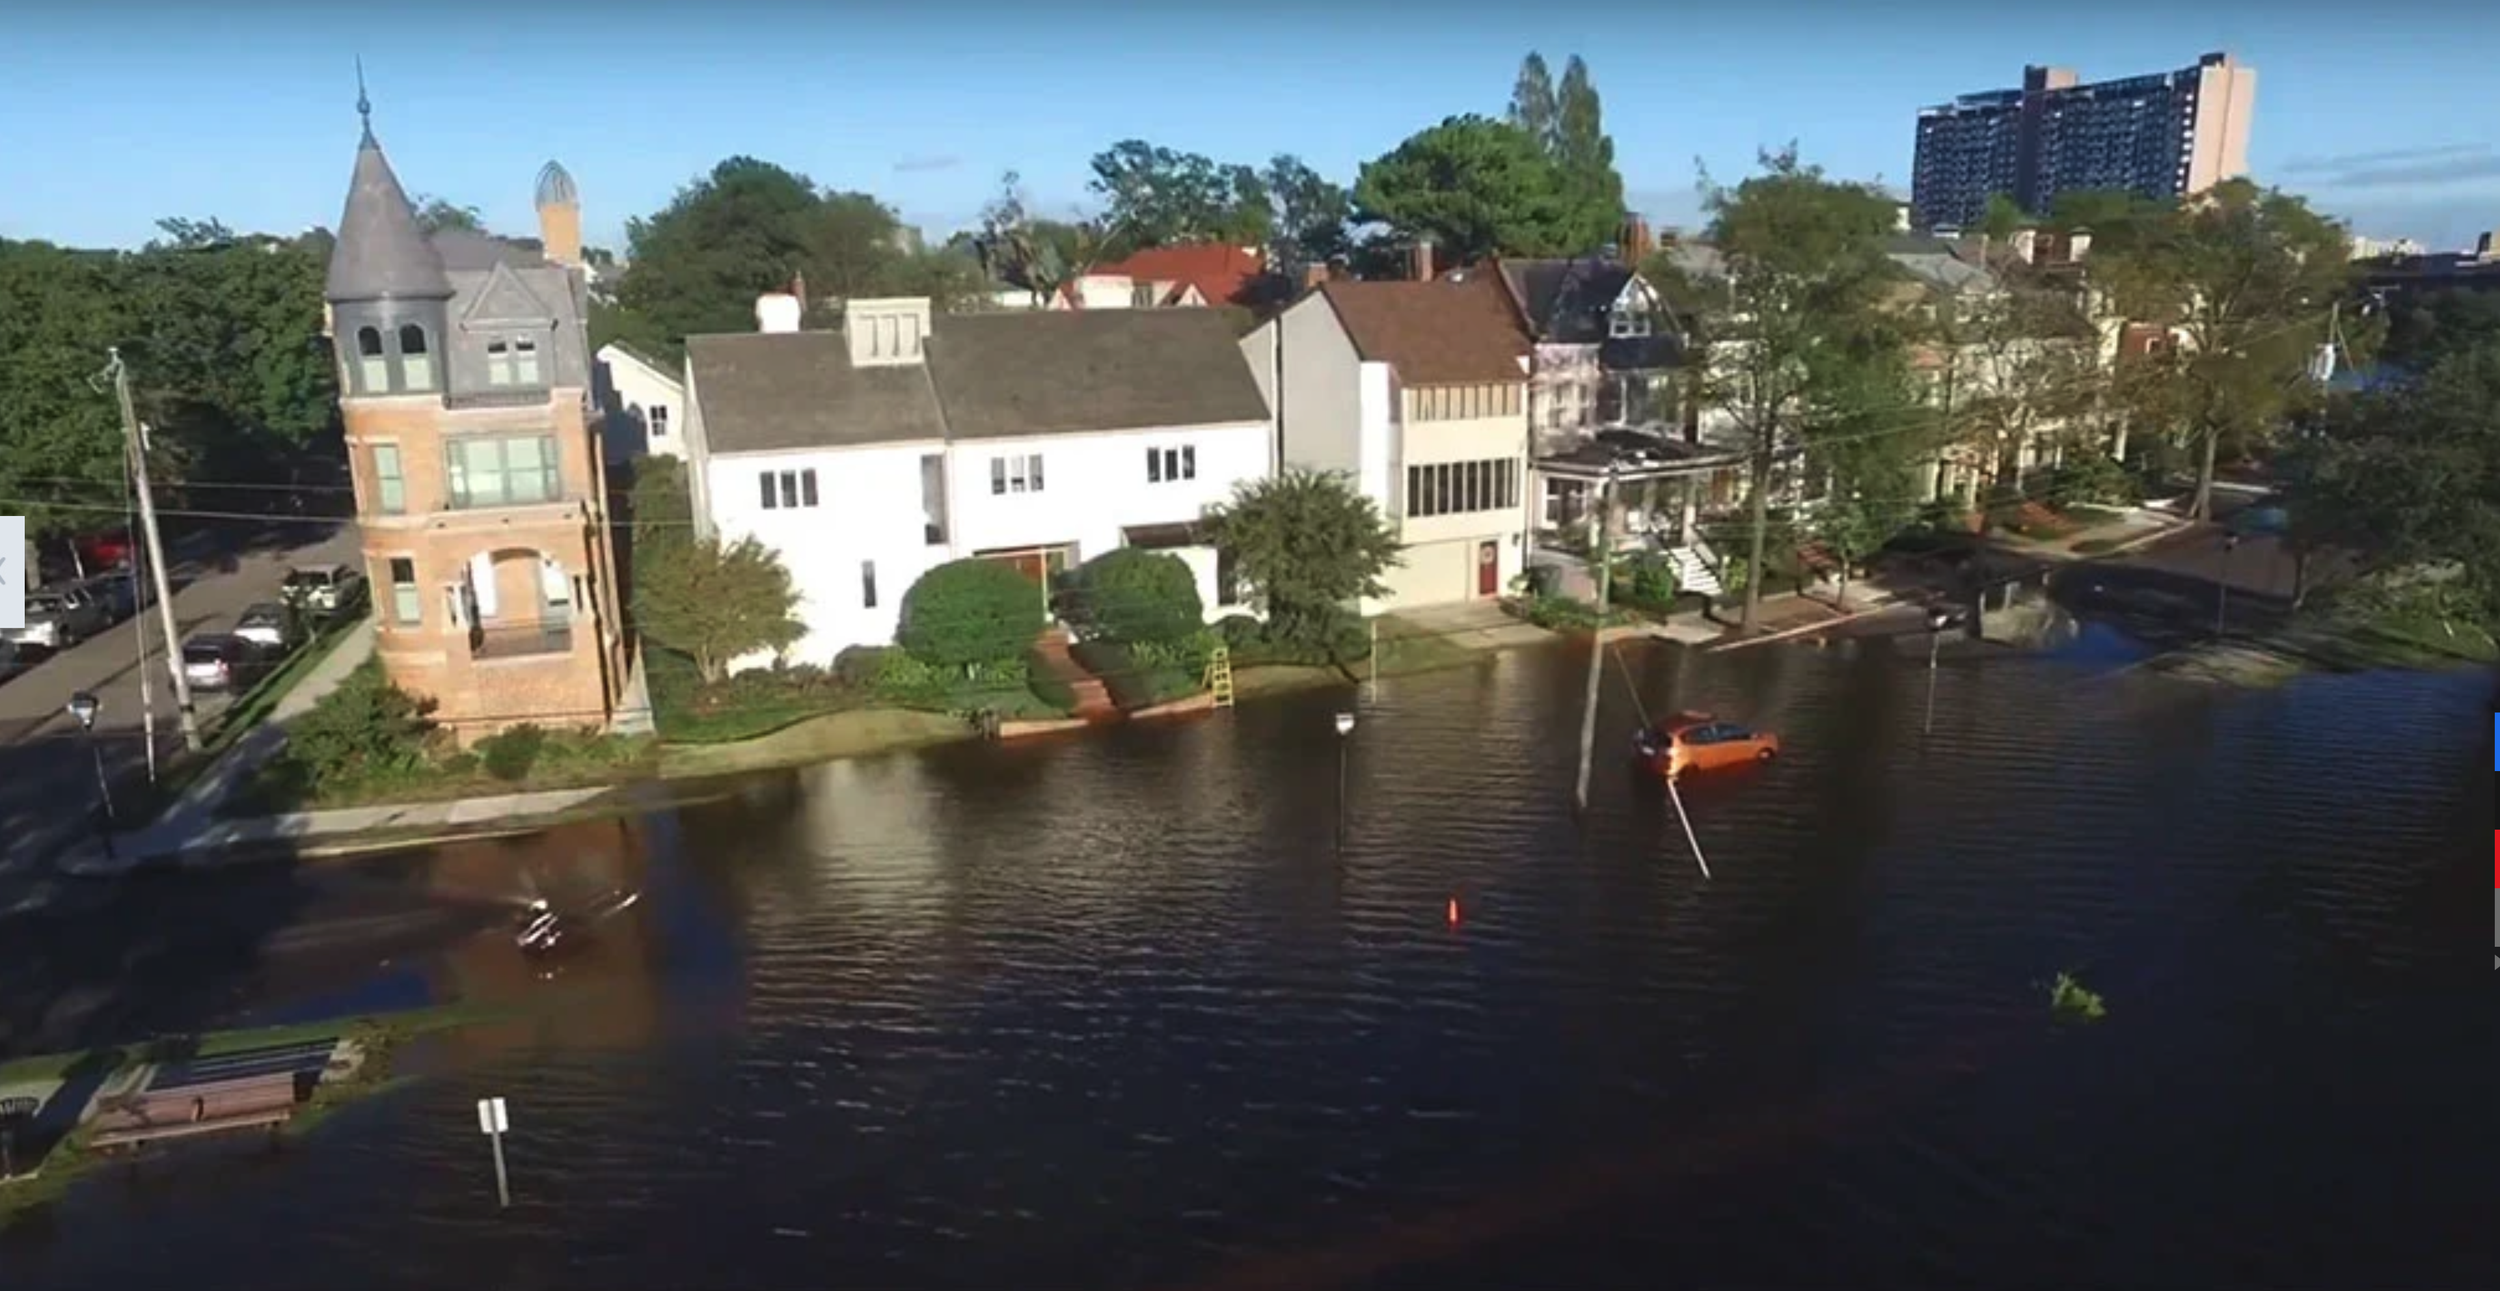
As if that had something to do with human CO2 emissions.
Reader Bill Ponton has looked into this, and has had some back and forth with NASA about what their data show. He has also come up with a few graphics to help make this understandable for the readers.
On February 24 Bill used the NASA sea level data since 1993 to create a graph, and then sought to fit two curves to the graph — one a straight line, and the other a parabola implying acceleration. Here are the results:

NASA sea level data with linear fit

nasa sea level data with parabolic fit
A first obvious question is, does your eye detect in the plot of data points any acceleration in the rate of rise? It is certainly not apparent to me. What is very apparent is that there was an anomalous increase in the rate of rise in 2017/18, followed by two years of actual decreases. Those two years of unusual increases may well explain the results of the Nerem, et al., paper (published in 2018).
The linear fit shows a steady increase of 3.2629 mm/yr. (That would be about one foot per century.). The R^2 is a measure of the closeness of the fit of the line to the scattered data points, and an R^2 of 0.9869 is a remarkably close fit. With this close a fit, and the line actually higher at the right side than the most recent data point, is there really any basis to claim an ability to detect an acceleration?
The second graph has a curve based on a quadratic equation, and therefore is shaped like a parabola — although it is almost impossible for the eye to detect the very slight upward curve. The fit, as measured by the R^2, is ever so slightly better than the linear fit, 0.9899.
Bill explains that the formula of the quadratic equation in the second chart would reflect an acceleration rate (if it is real) of 0.045 mm/yr^2, or only about half of that claimed in the Nerem, et al., paper.
Bill then commenced an email correspondence with a guy name Josh Willis at NASA. He asked Willis whether there was any reason to try to fit a parabola to these data, rather than just a straight line, to which he got the response “A linear fit is not a ‘simpler’ explanation, it is an incomplete one. The acceleration is real, and there is no justification for ignoring it.” Note that Willis has no basis for claiming that the acceleration “is real” other than the data, which are the same data that you and I can look at. Willis then referred Bill to the Nerem, et al., paper. But Bill pointed out that Nerem, et al., claimed an acceleration of 0.084 mm/yr^2, whereas the NASA data as of February 2024 at best would only support an acceleration rate of 0.045 mm/yr^2. Bill remarks, “Josh must have found this to be a troubling contradiction because soon after he indicated that he preferred our correspondence cease.”
But meanwhile, in early March the sea level data reported by NASA suddenly got altered. Here is a graph provided by Bill showing the NASA data before and after alteration:

Before Willis cut off correspondence, Bill got the following (totally inadequate) explanation for the alterations: “[T]he data on the websites was recently updated to include improved estimates of sea level from our first precision sea level satellite, TOPEX/Poseidon, and to correct small errors in later missions. Sure. Most of the actual readings have become lower, but an enhanced curvature has been introduced. The quadratic formula of the best fit for the red (altered) data points now would imply an acceleration rate of 0.065 mm/yr^2. That’s still well less than the 0.085 mm/yr^2 claimed in the Nerem, et al., paper, but at least not so embarrassingly far off.
Is all of this anything to get scared about? Absolutely not. As stated earlier, linear sea level rise of about 3.3 mm/yr is consistent with what has been going on throughout history since the last ice age, and implies a rise of around one foot by 2100. Nerem, et al., state in their paper that the acceleration rate that they estimate of 0.084 mm/yr^2 would imply sea level rise of 65 cm by 2100, which is 25.6 inches, or just over 2 feet. The rate of 0.045 mm/yr^2 derived from the unaltered NASA data would imply a much smaller increase by 2100 of about 16 inches, really not much more than the ongoing linear trend. Meanwhile, here in Manhattan, where everyone claims to believe the worst climate scare stories, the fanciest new condos continue to get built along the shoreline, just a few feet above sea level. The new thing is to put the building mechanicals a few floors up, in case some big storm brings the sea water into the basement.
What’s most interesting about all this is what it reveals about the sea level rise scare story. The claims of “acceleration” prove to be based on dubious extrapolations from data that show only very slight, if any, deviations from linearity. Those slight deviations may reflect some underlying process or may just reflect the effect on a curve-fitting exercise of one or two outlying data points. Our overlords modify the data to enhance the apparent acceleration, and then claim the ability to use a slight non-linearity to project sea level out 80 years or so to try to scare us with a few inches of difference. In the real world, the few extra inches are insignificant, and none of us will even be around then anyway. I plan to recommend to my grandchildren — all now 5 and under — not to live too near the coast in their retirement. That should take care of it.
The lengths that the bureaucrats will go to maintain their scary narrative are truly extraordinary. And what’s most amazing is how many seemingly smart people don’t see through it.