How Can Democrats Possibly Run On "Affordability"?
/We are now less than a month out from the mid-term elections, and the single biggest theme that the Democrats have chosen to run on appears to be “affordability.”
How can this possibly be? We live in the age of immediate availability of information, let alone artificial intelligence to track down anything that might previously have been challenging to find. If you want a state-by-state comparison of costs for any particular thing, you can get it in a fraction of a second. The results are in: the Democrat-run states are less “affordable.”
The Democrats and Republicans propose opposite strategies for dealing with the economy. The Democrats advocate for higher government spending, higher taxes, and more regulation of business; and the Republicans advocate for lower spending, lower taxes, and less regulation of business. The states are the “laboratories of democracy,” where we get to see the consequences of disparate policies play out, and to evaluate the results. Neither party is perfect in implementing what it advocates, so there are always some complexities. But in the main it is easy to collect data that give a relatively clear picture of the results of Democrat versus Republican policies.
So let’s consider some examples from among the most prominent issues today.
Electricity Prices.
The federal government’s Energy Information Administration puts out monthly data (with some lag) of state-by-state average electricity prices per kWh to the “ultimate consumer.” Here is the latest chart (July 2026 data). There are separate columns for electricity prices for “residential,” “commercial,” “industrial,” “transportation,” and “all sectors.” The “residential” column is perhaps most relevant to the “affordability” issue.
The national average residential price is 18.31¢/kWh. Alaska and Hawaii are outliers due to geographic remoteness. Putting those aside, the highest prices are in the deepest blue states that have most aggressively pursued the fossil fuel suppression policies to “save the planet” from climate change. California has the highest prices among the lower 48 (33.61¢/kWh), followed by a gaggle of Northeastern states that have joined the “Regional Greenhouse Gas Initiative” to intentionally drive up their electricity prices (Maine 32.41¢/kWh; Massachusetts 30.49¢/kWh; New York 29.90¢/kWh; Rhode Island 28.29¢/kWh; New Hampshire 26.60¢/kWh; New Jersey 25.19¢/kWh). At the other end of the price spectrum, we find either Republican-run states or a few Democrat states with the good fortune of cheap hydropower: Louisiana 12.72¢/kWh; Nevada 12.77¢/kWh; Utah 13.12¢/kWh; North Dakota 13.41¢/kWh; Tennessee 13.71¢/kWh; Idaho 13.73¢/kWh; Nebraska 13.78¢/kWh; Kentucky 13.81¢/kWh; Wyoming 14.36¢/kWh; Oklahoma 14.35¢/kWh; Arkansas 14.33¢/kWh.
There really can’t be any doubt at this point about which set of policies leads to cheaper electricity.
Gasoline Prices.
Differences in gasoline prices present a red/blue divide that is not quite as clear as differences in electricity prices, but it is close.
The American Automobile Association publishes data on State Gas Price Averages, up-to-date every day. Here is today’s chart. (That link may go to charts that change each day.). They publish a color-coded map indicating states with high, medium and low average prices:
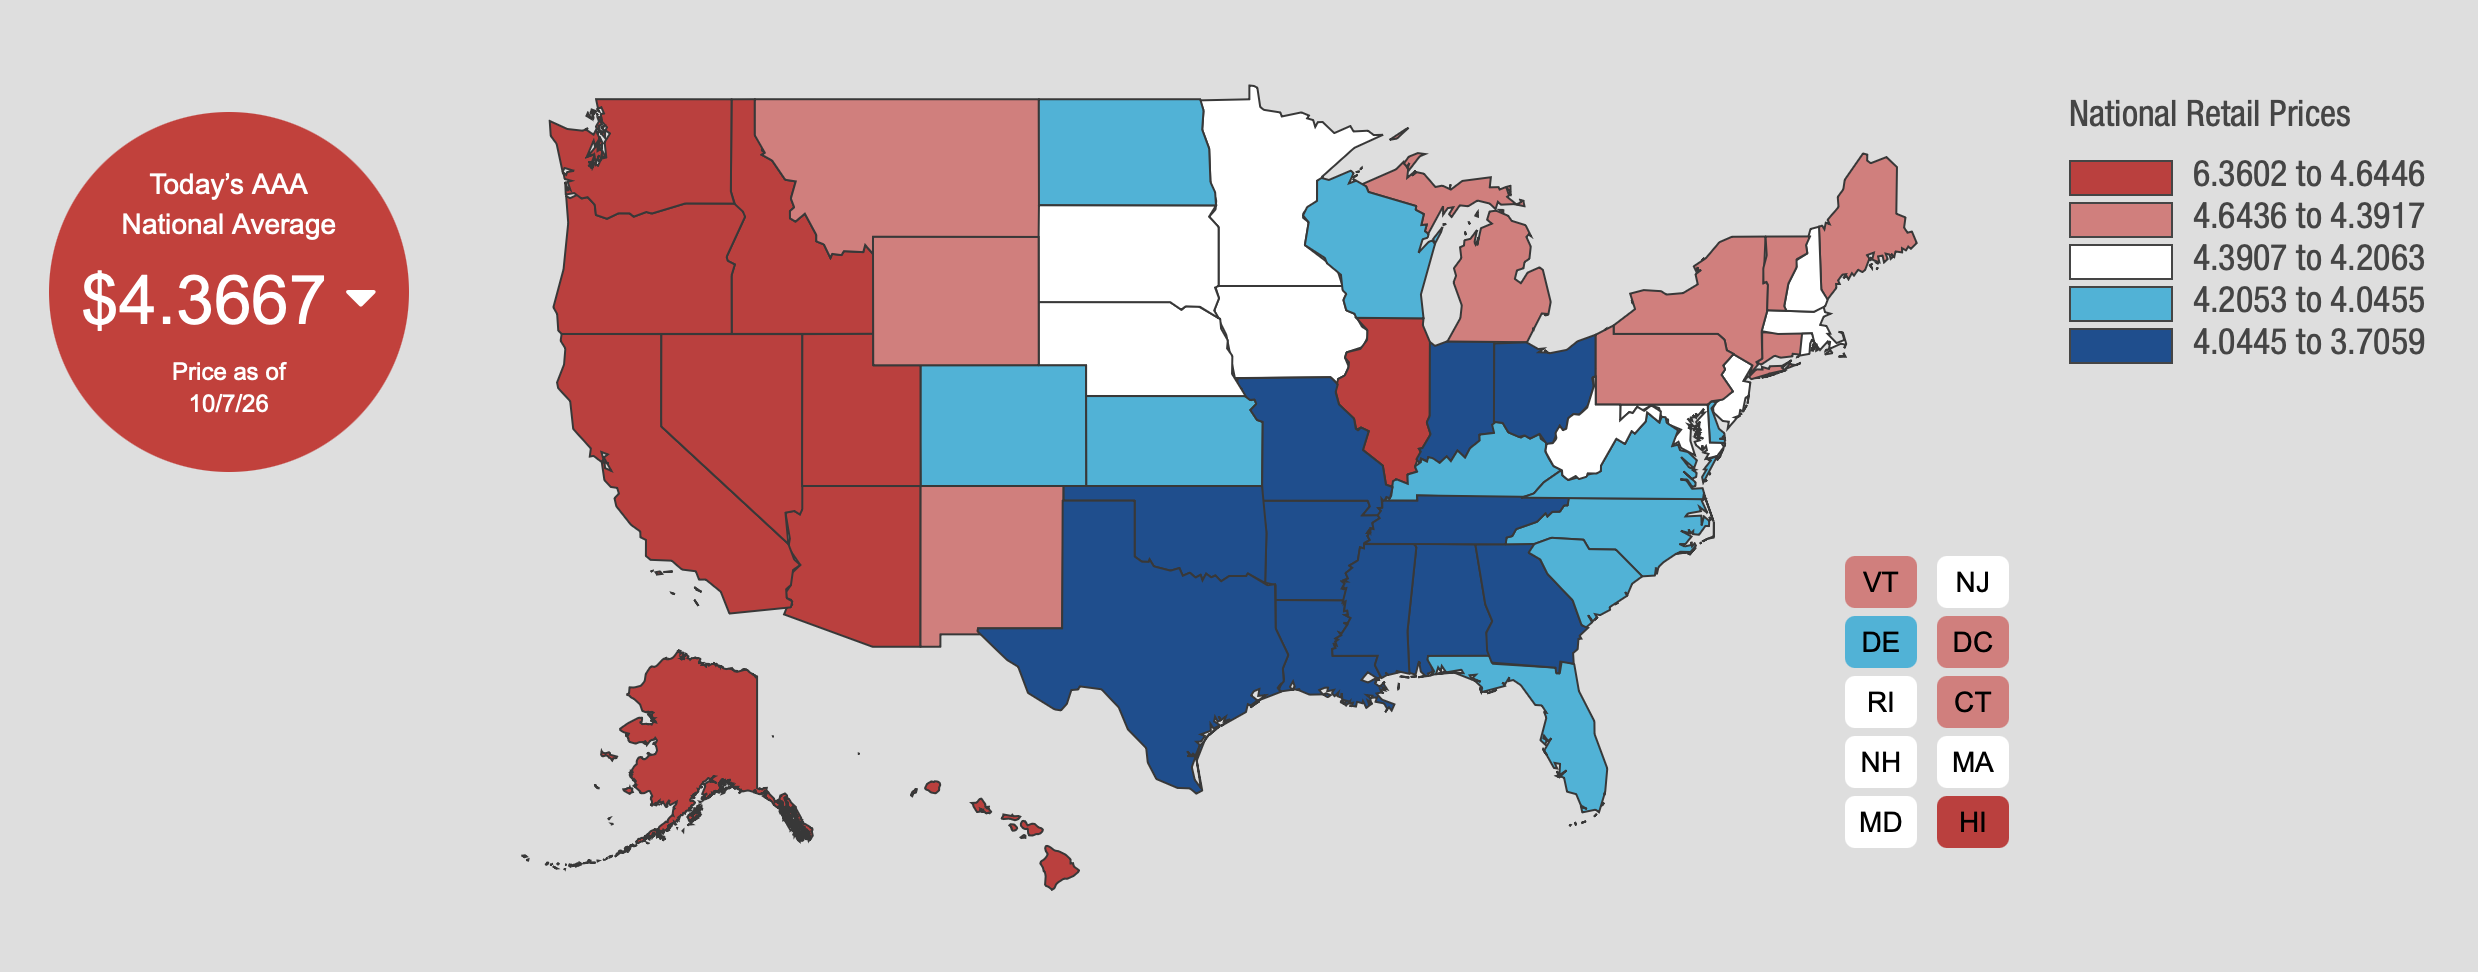
If you go to the link and hover your cursor above any state, you will get today’s price for that state. The swath of mostly Republican-led states across the South and Midwest has the lowest prices. California again has the highest of the lower 48: $6.3602 today, against a national average of $4.3667. The reasons for California’s extraordinarily high prices have been well publicized: a combination of environmental restrictions on drilling and on refineries (causing many of those to close), plus special required blends of gasoline, and high taxes. California’s restrictions on refineries have had the unfortunate effect of dragging many neighboring states, even partially or fully red ones, into gasoline price purgatory, although the prices in these states are much lower than in California (e.g., Nevada $5.4645; Idaho $4.9303; Arizona $4.7263). High prices in the blue Northeastern states are driven by regulations and high taxes (e.g., New York $4.4678; Connecticut $4.4437; Massachusetts $4.3452).
State and Local Tax Burden
The Tax Foundation publishes a chart of annual state and local tax collections per capita. Here is their chart for 2026. D.C. ranks number one at $15,009, followed by New York ($12,506), North Dakota, Hawaii, Connecticut, New Jersey, Massachusetts, New Mexico, California, Vermont and Illinois ($8,339) to round out the top ten. North Dakota is the only red state outlier there, explained by the fact that they produce a lot of oil, taxed at the well-head, and have a small population. So the tax burden on the populace is actually low.
At the low end it is entirely red states with the possible exception of purple-ish Arizona (in order starting from the lowest: Mississippi ($4,868), Tennessee, Alabama, South Carolina, Arizona, Idaho, Florida, Missouri, South Dakota, Arkansas, Oklahoma ($5,312)).
How Democrats can claim the mantle of “affordability” in the face of easily-available data like these is beyond me.