Hurricane Isaias: The Data Are In
/We finally had our first hurricane this season in the North Atlantic region: Isaias. Isaias formed on October 7 as a tropical storm in the Gulf of America, and made landfall as a Category 1 hurricane on October 10 near Destin, Florida.
Paul Homewood of Not a Lot of People Know That collects the relevant data in a post from October 11.
Homewood notes that Isaias represents the latest ever first hurricane for the North Atlantic, at least since the satellite era (1966) has provided full data:
Isaiah was the first Atlantic hurricane of the season, the latest on record. The previous record was Sep 11th in both 2002 and 2013.
So Isaias broke the previous record for latest formation of the first hurricane by almost a full month.
And besides being late, Isaias was also rather unimpressive. Homewood has full data on Isaias’ wind speeds and Category designation:
Having briefly reached Cat 3 hours before landfall, the storm weakened considerably by the time it reached the coast. NWS claim sustained winds of 105 mph, but there is no evidence for this. Surface wind measurements put the highest wind gusts at 118 mph, but sustained winds are always much lower. Gusts at Santa Rosa, for instance, peaked at 116 mph, but NWS confirm sustained winds of 91 mph, which would mean it was only a Cat 1 hurricane at landfall.
Homewood provides a link to National Hurricane Center data on the hurricane, where NHS claims that their radar measured sustained winds at landfall of 105 mph. If correct, that would put Isaias into Category 2. However, Homewood observes that the highest sustained winds as measured at any ground station were 91 mph, well within the bounds of Category 1.
Meanwhile, the hurricane season continues to progress towards its conclusion. According to the NHC page today, there are no more hurricanes at this point in the Atlantic, and “tropical cyclone activity is not expected during the next 7 days.” With each passing day this late in the season, the likelihood of another hurricane declines rapidly.
To those who have accused me of cherry-picking the North Atlantic hurricane data, I say that I was not the one who suggested that metric to test the hypothesis of “more and more severe storms and hurricanes.” The metric was selected by advocates of the hypothesis when a few strong and widely publicized storms made it appear to be a useful metric to scare the public.
Now that the North Atlantic hurricanes are a bust, let them select a new metric for themselves, and see how it turns out. Homewood’s post contains two other charts. The first is from NOAA’s Atlantic Oceanographic & Meteorological Laboratory. It shows simply the number of hurricanes making landfall by year in the U.S., going all the way back to 1851. Homewood has added a red line showing a 30-year running mean:
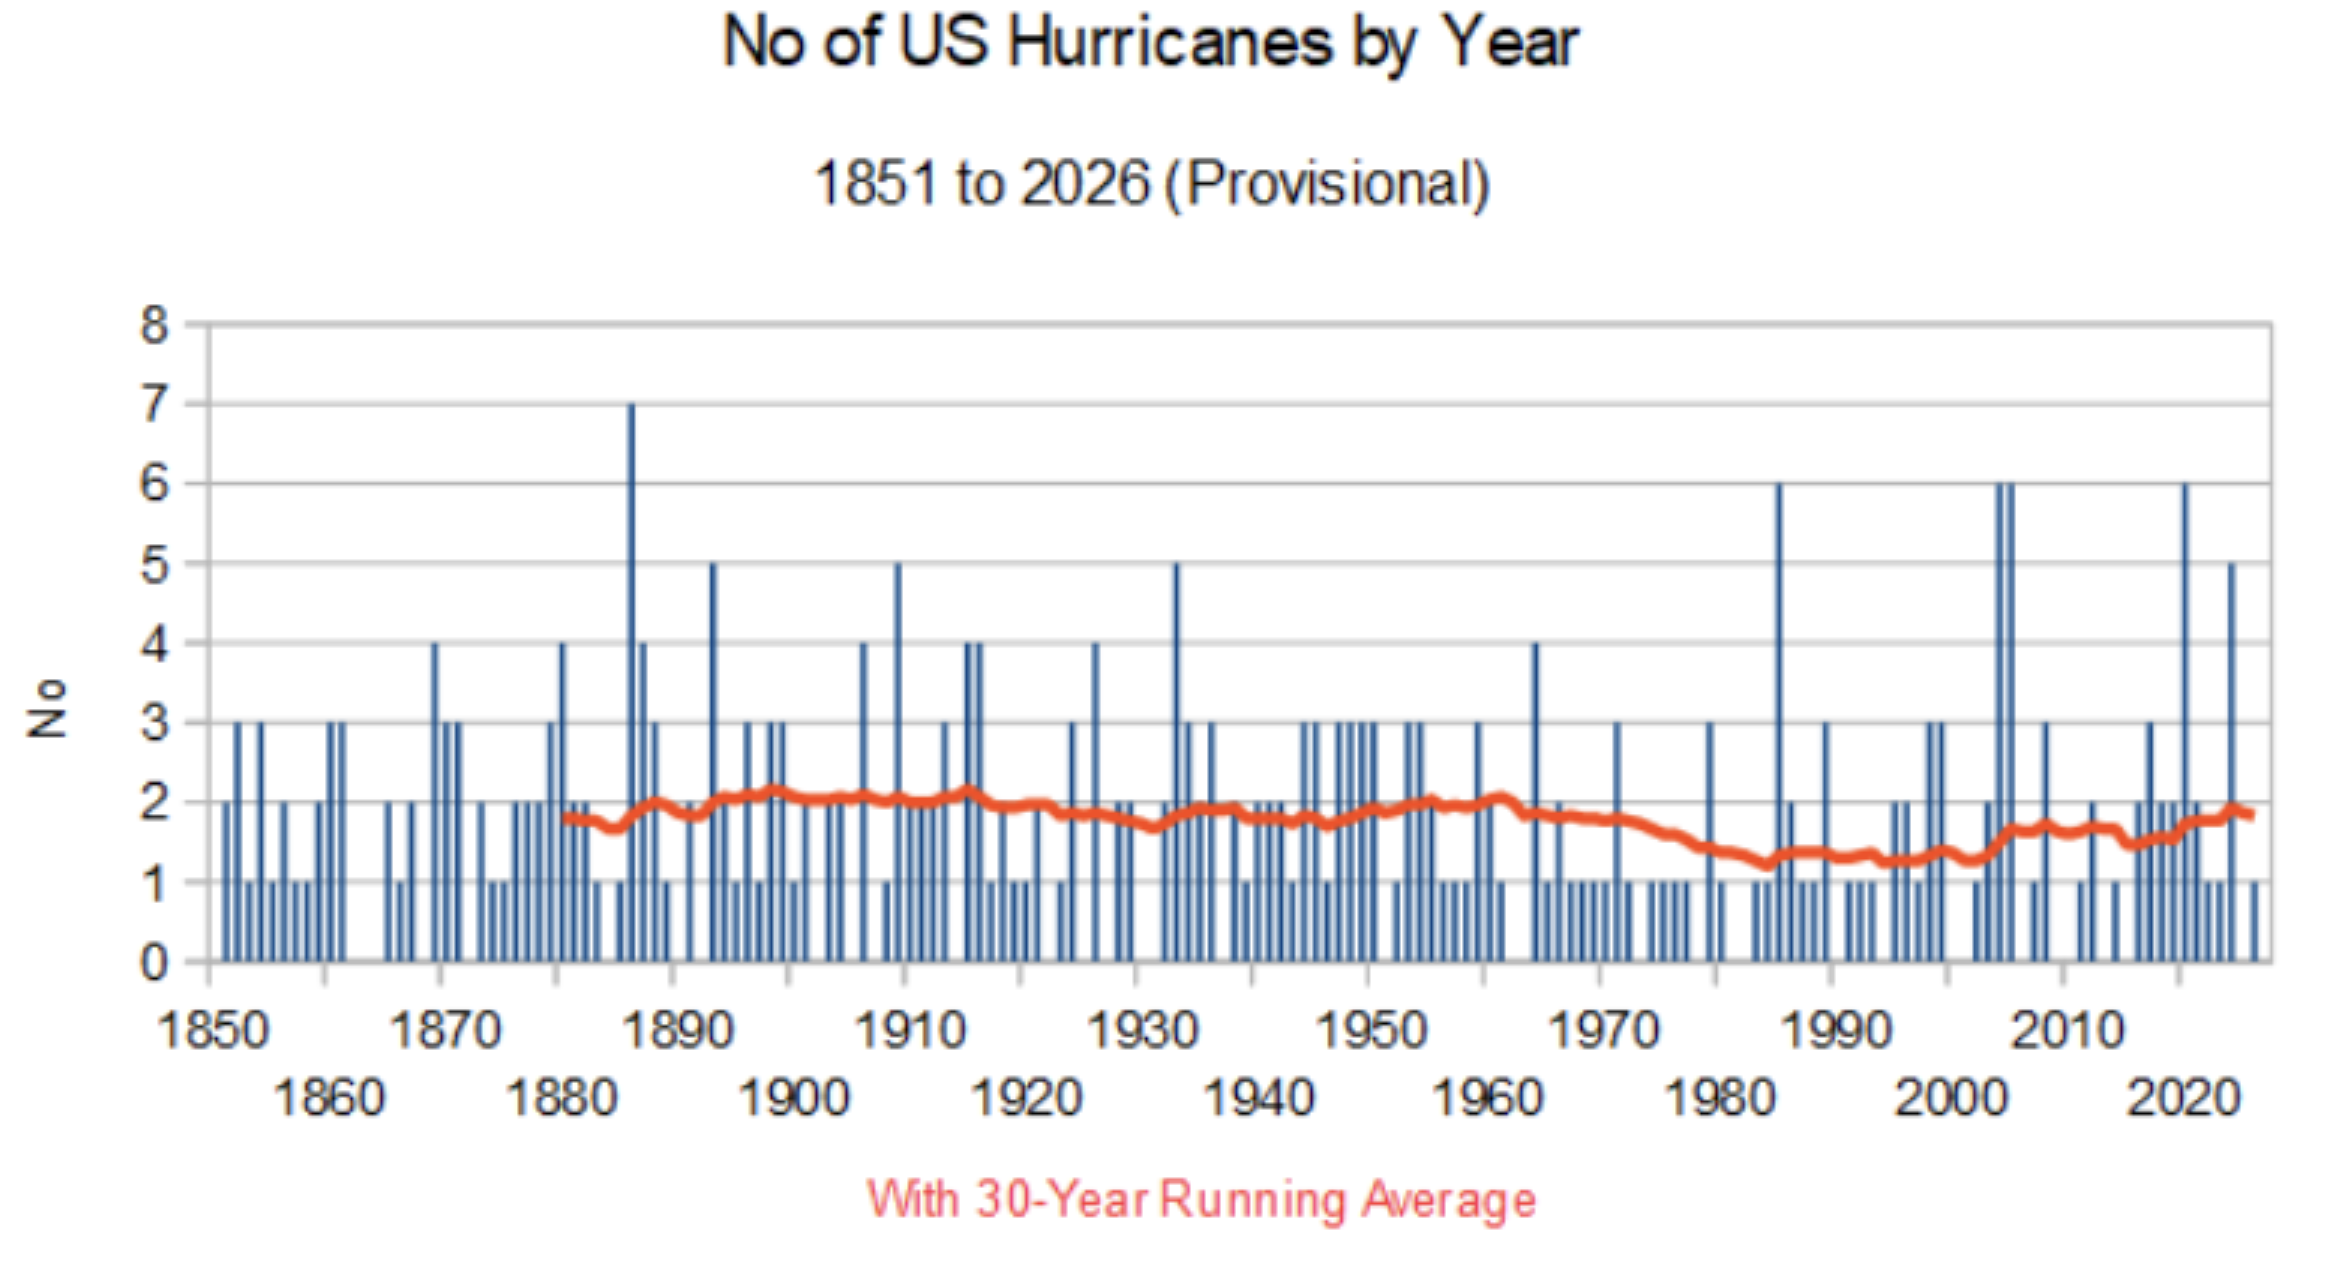
No noticeable trend there. The record year was 1886.
Another possible metric is global hurricane frequency. For that one, Homewood provides one of Ryan Mate’s charts with global data going back to 1980:
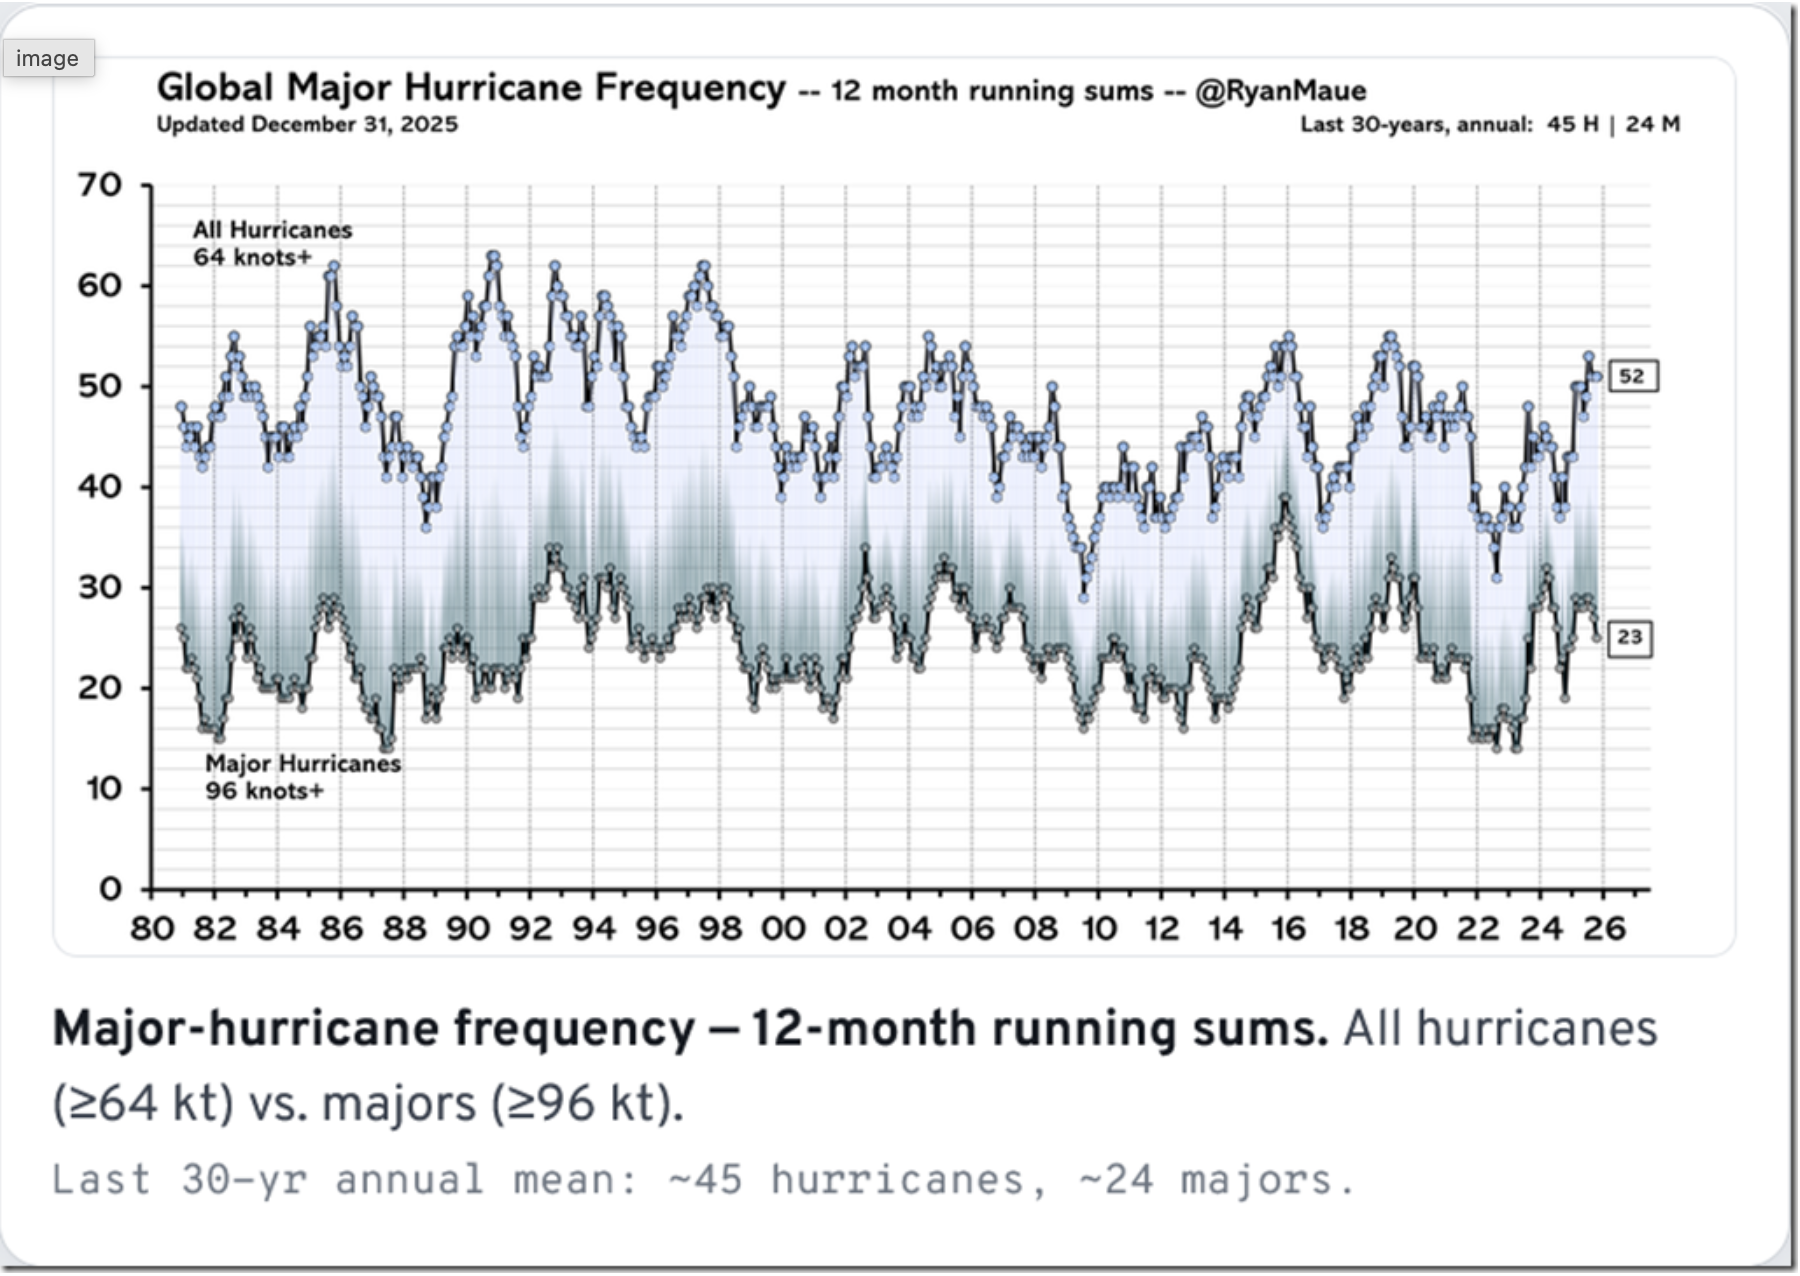
No noticeable upward trend in that one either. And then there’s the Accumulated Cyclone Energy metric, for which I provided a chart of global data in my October 4 post. That makes four proposed metrics so far, and the “more and more severe storms and hurricanes” hypothesis has failed all four of them.
But maybe advocates of the “more and more severe storms” proposition have yet another metric they would prefer. If so, name it! They won’t, because once they name their metric, they must agree that the hypothesis is falsified when the metric fails to perform as predicted.
I think that we are well past the point where the “more and more severe storms and hurricanes” hypothesis has been falsified.