Ever More Absurd New York City Education Spending
/In a post back on March 23 (“Trying To Head Off New York’s Total Self-Destruction”), I took note of the recent issuance by a think tank called the Empire Center of a big Report titled “Next New York.” The Report shines a spotlight on one area after another where progressive New York politicians have implemented destructive and crazily-expensive policies. My March 23 post discussed the subject of energy policy. Before too much time has passed, I want to delve into at least one or two more areas. For today, it’s public education.
The Next New York Report covers public education in a 15-page segment (pages 29-43) written by Ray Domanico.
The simple and undeniable fact is that New York, both State and City, spend ridiculously more on K-12 education than any place else in the country. Perhaps that could be justified if the results were notably superior. But in fact the results not only are not superior, but are actually worse than the national average at most of the measured data points. Meanwhile, our teachers union — the American Federation of Teachers, headed by Manhattan resident Randi Weingarten — demands and gets ever more funding for ever worse results.
Domanico produces the following chart of per-pupil K-12 education spending for New York versus the full U.S. from 2000 to 2020. Note that this is New York State, rather than New York City. Note also that the gap between New York’s spending and the average of the other states grows every year:
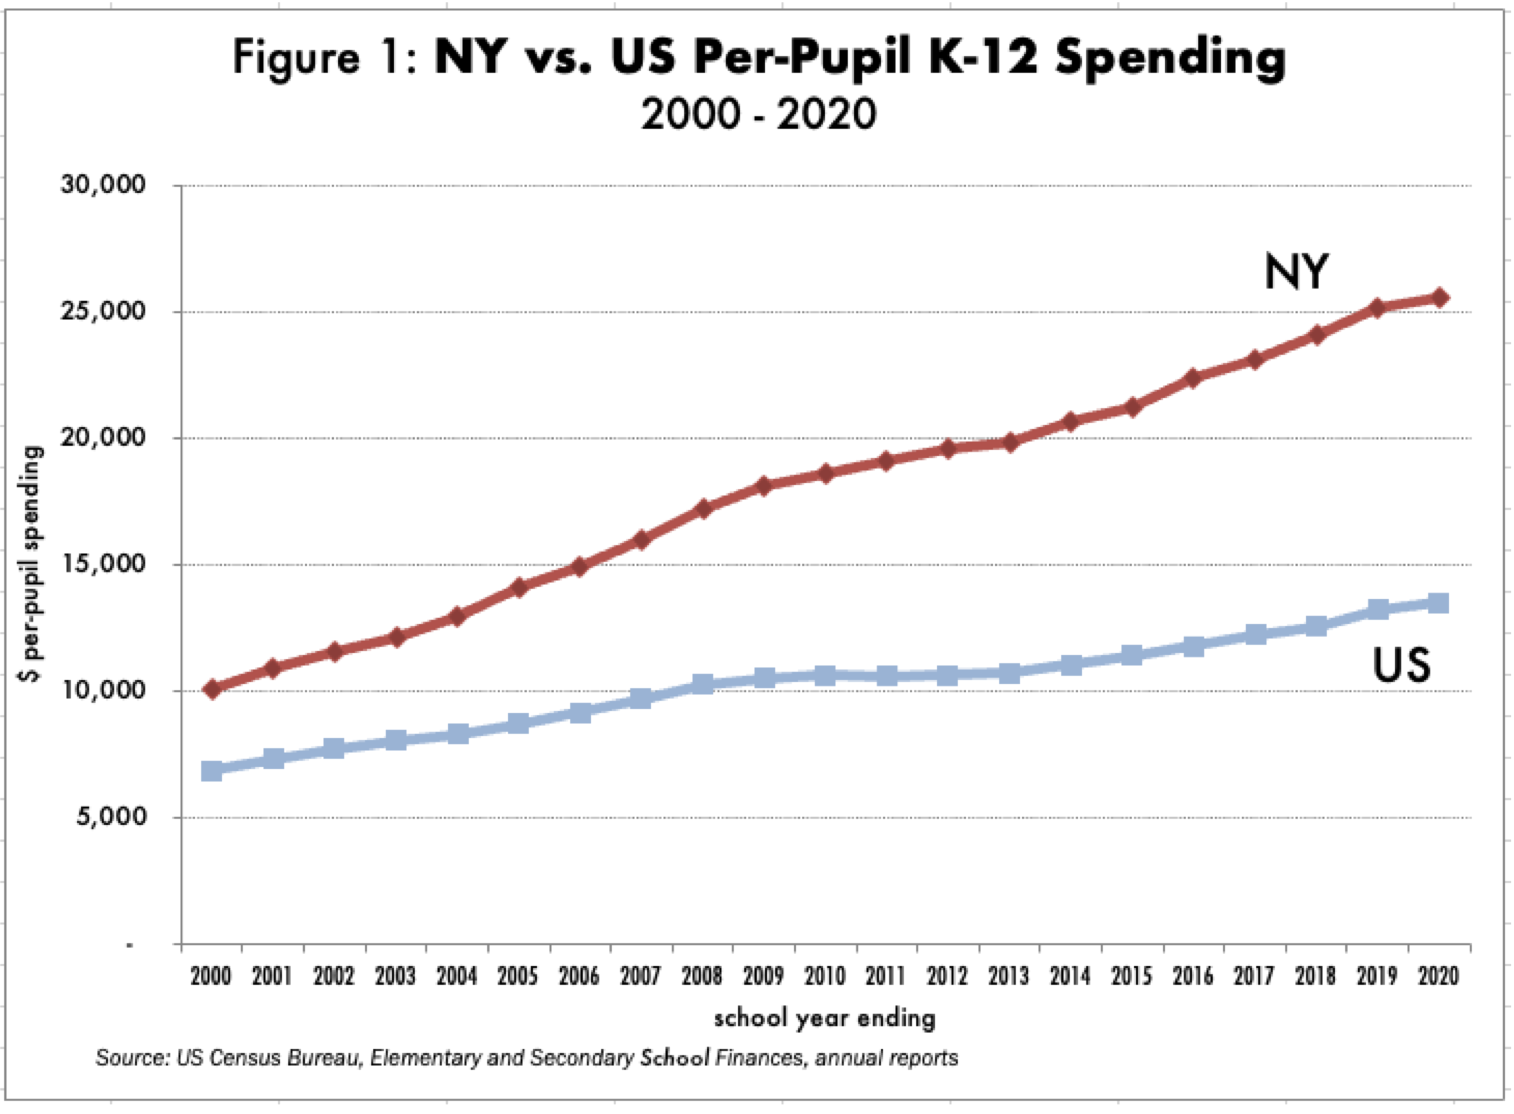
In 2000 New York State spent an average of about $10,000 per pupil, versus a national average of about $7000, representing about a 42% premium. By 2020, New York State spent about $26,000 per pupil, versus a national average of about $13,500, for a premium of about 93%.
In New York City, it’s far worse. How much does New York City spend per pupil in K-12 education? Domanico does not include such a figure in the Next New York Report; and it’s not necessarily an easy number to come up with, since various dollars of education spending are spread among different categories in the City budget. The just-enacted City budget for the 2024 fiscal year allocates $30.6 billion to the Department of Education. Teacher pensions are in a separate category, constituting at least another $4 billion. Divide that $34.6 billion by the claimed total of about 1.05 million students, and you would get just under $33,000 per student.
But are we still missing some other hidden categories of K-12 spending? A watchdog group called the Citizens Budget Commission does their own analysis in this Report on New York City School Spending dated April 11, 2023. They do a detailed allocation of pension contributions to the Department of Education, and also allocate to education spending the portion of debt service applicable to schools and also certain other fringe benefits paid centrally. Their result: $38,000 per student for New York City K-12 education for the coming 2024 FY. Pithy quote:
Long-term enrollment declines accelerated during the COVID-19 pandemic. Between school years 2015-16 and 2021-22, K-12 DOE enrollment declined by more than 141,000 students, with the largest losses (90,000 students) occurring during the pandemic. Simultaneous spending increases and enrollment declines led to rapid increases in per-student spending. In fiscal year 2022, the DOE spent more than $37,000 per K-12 DOE student—up 15.2 percent from the prior year and 46.9 percent since fiscal year 2016, including centrally allocated cost.
That $38,000 is well more than two and a half times average per pupil spending for K-12 education in the U.S.
So surely for that vast spending differential we get dramatically superior results? Just kidding. A New York City education website called Chalkbeat summarizes the results of the NAEP tests (most recently administered in 2022) for the full U.S., New York State and New York City:
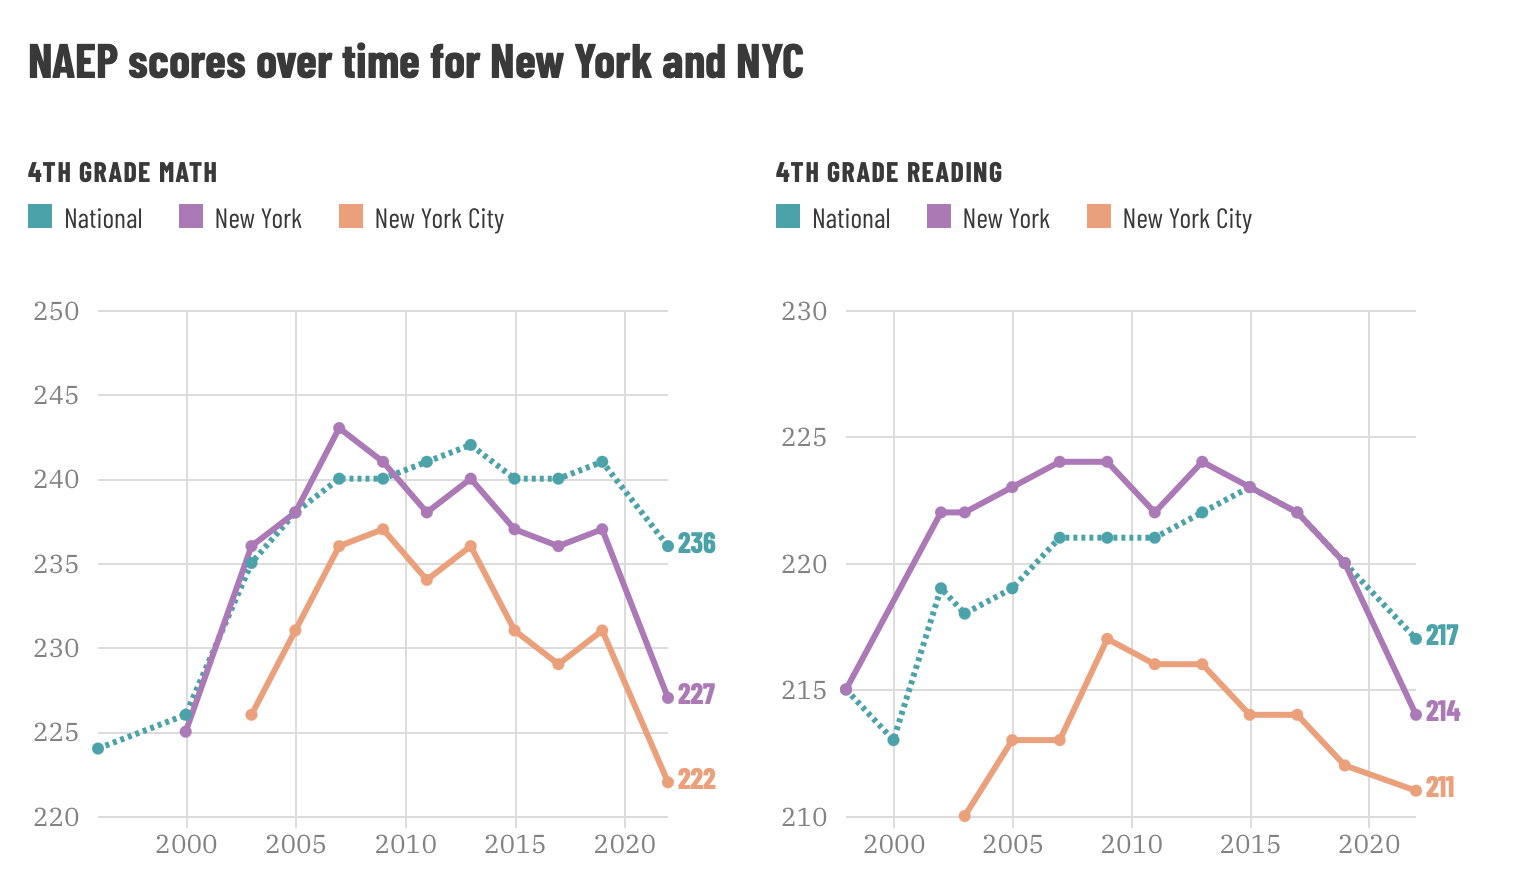
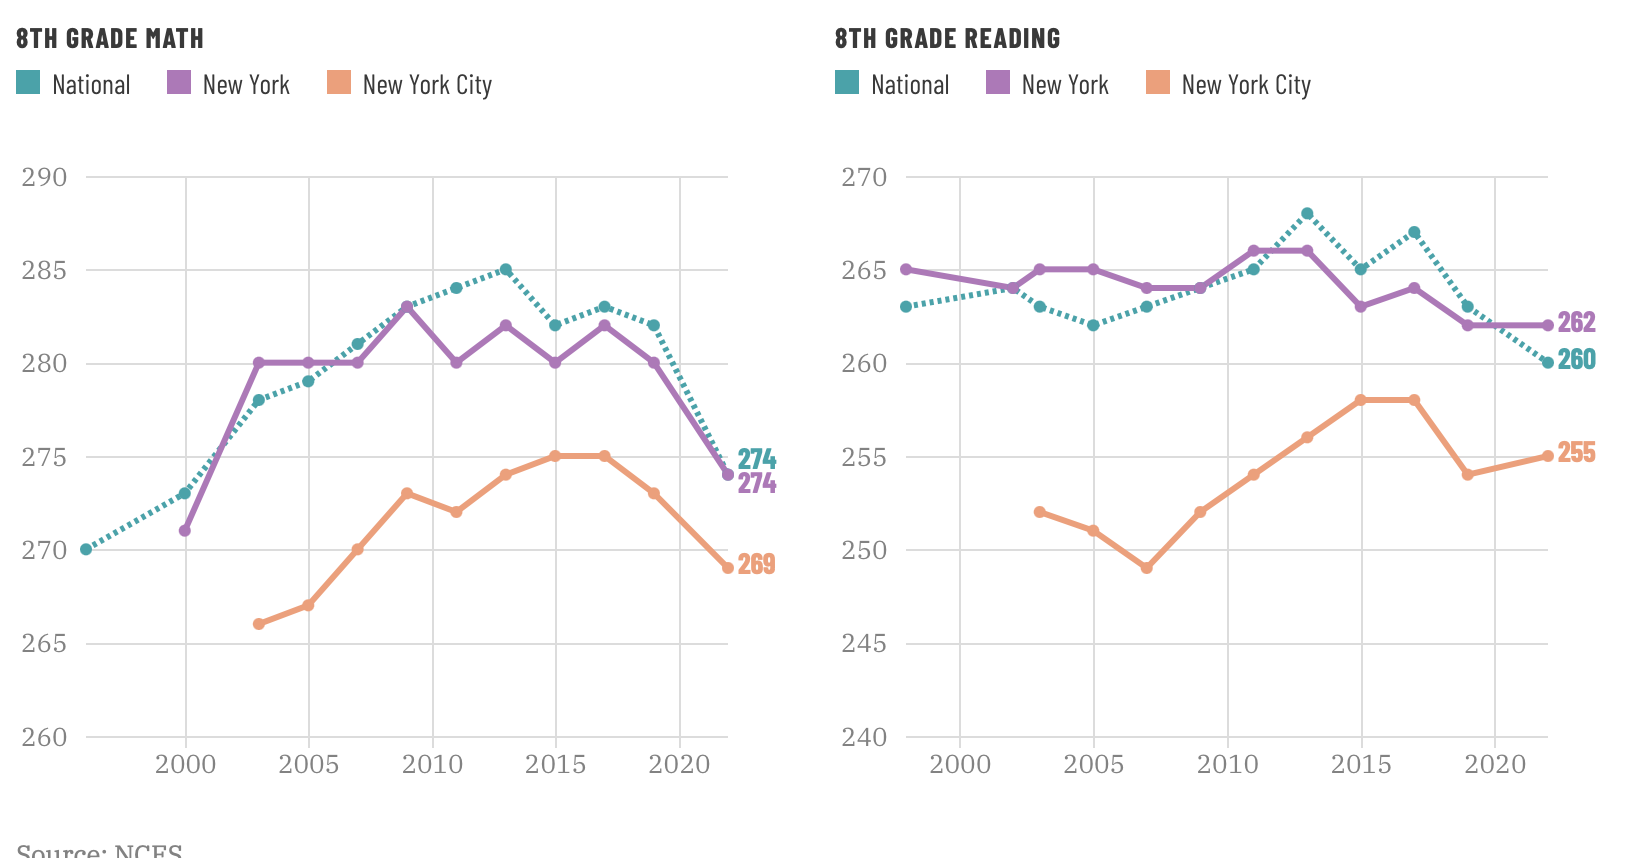
For all its vast spending, New York City comes in consistently below the rest of the state, which then is also consistently below the rest of the country (except for 8th grade reading in the most recent assessment).
As far as I know, only one thing has been shown to materially improve the test scores of the students in New York City, and that is charter schools. Domanico comes up with this chart comparing results of New York students on the New York State exams (different from NAEP), comparing charter school results to those of the traditional “district” schools, and also breaking out separately the results for black students:
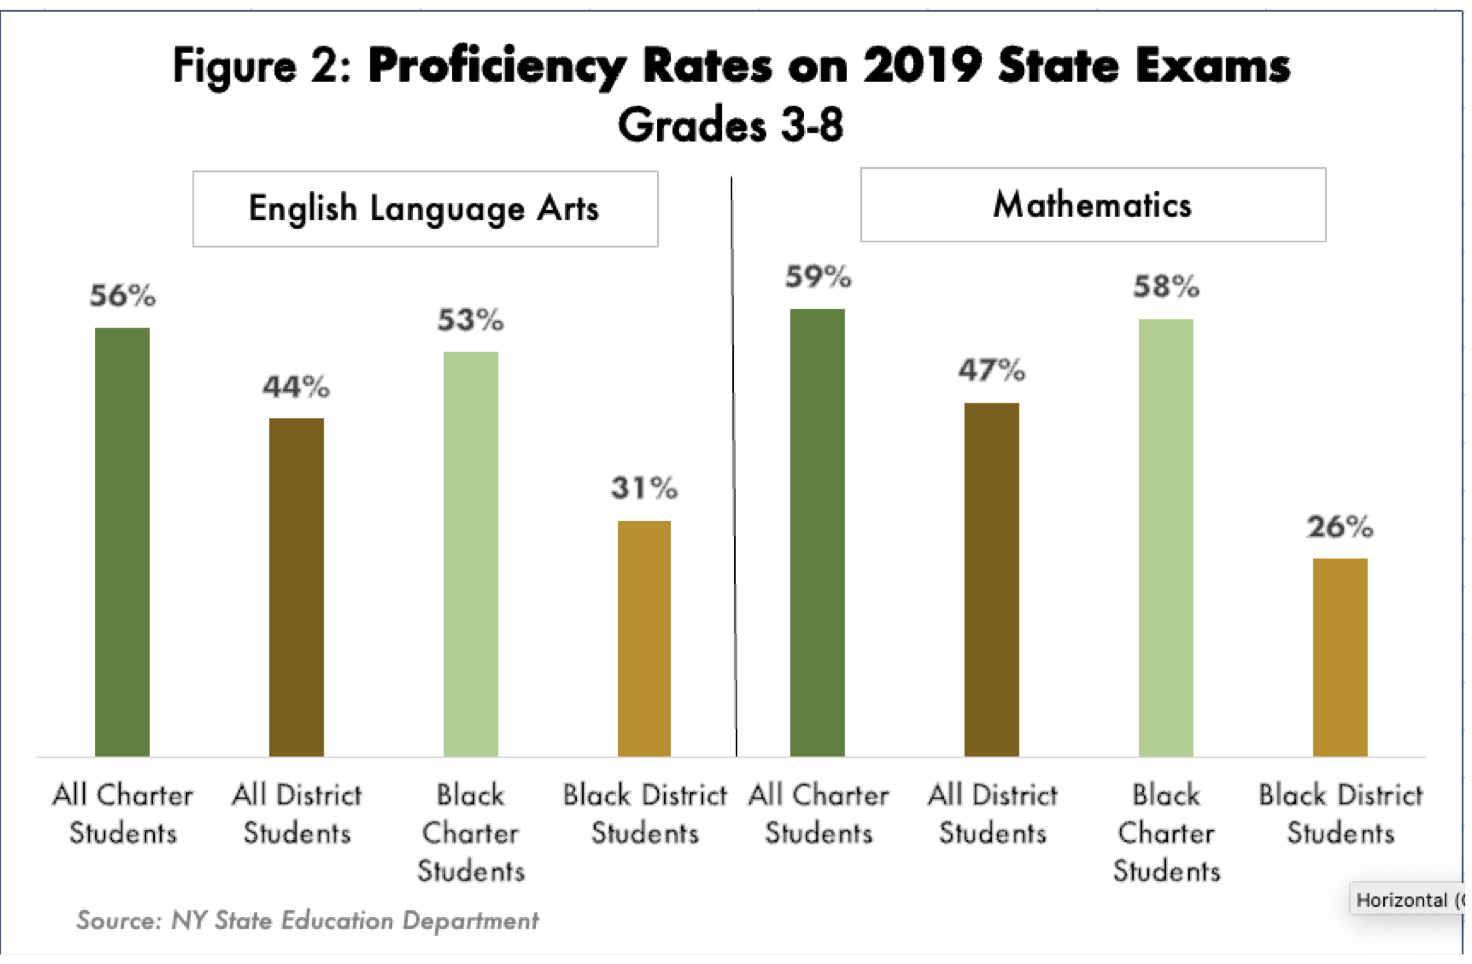
Note that the above chart is New York State data (rather than just the City); however, the large majority of the charters are in the City.
Needless to say, in the recent State budget process the teachers union fought tooth and nail to prevent any expansion of charter schools in New York City. The end result was that a minimal 24 additional charters will be allowed in the coming year. The large majority of the black students will continue to be trapped in the failing “district” schools, where their rates of proficiency will continue to be barely half that of their friends who succeeded in the lotteries to get into the charter schools. All the “progressives” in the State Legislature stood unanimously behind this policy. It is shameful.