The Greatest Scientific Fraud Of All Time -- Part XXIX
/This is the 29th post in a series going all the way back to July 2013. For newer readers, what I refer to as “The Greatest Scientific Fraud Of All Time” is the systematic alteration of world temperature history records to create and/or augment a warming trend, and thereby support a political narrative that the world’s energy economy needs to be completely transformed by government command in order to avoid catastrophic human-caused climate change.
A U.S. government agency called the National Centers for Environmental Information (NCEI, in turn a part of the National Oceanic and Atmospheric Administration (NOAA), which is part of the Department of Commerce) is the most important source for world historical temperature information. NCEI collects data daily from a network of several thousand ground-based weather stations both in the U.S. and around the world, and reports the results in various “global time series” going back to 1880. When graphed, the NCEI data show the classic “hockey stick” formation, with rapid, and seemingly alarming, temperature increases in recent years.
But the NCEI data as presented have been subject to extensive massaging, referred to as “homogenization,” before being finalized and presented to the public as the alarming hockey stick. Curious citizens, seeing the government bent on undermining the reliability and cost of the energy system based in substantial part on these charts, might reasonably ask, what is the level of accuracy of the temperature presentation, and how much of the presented temperature increase is real versus an artifact of adjustments made by bureaucrats with a vested interest in getting the “right” outcome?
This post is a direct sequel to Part XXVIII of this series, which appeared in August 2021. That post noted that NOAA/NCEI make no secret of the fact that they are altering the raw data, and they give what appear to be legitimate reasons for the adjustments (e.g., a given temperature station may have moved to a warmer location); but at the same time they make the details of the alterations completely opaque such that no outsider can directly assess the appropriateness of each adjustment. Part XXVIII specifically discussed some work by a Japanese scientist named Kirye, that had appeared at No Tricks Zone, where she gathered pre- and post-adjustment data from six weather stations in Ireland and Greece, and showed that in each case NCEI had altered the 1988-2020 temperature trend at the station from down to up, without any association of the data alterations with any specific event, such as a station move or instrumentation change, that might give rise to legitimate “homogenization.”
Today’s post now reports on a new article (February 8, 2022) published in the journal Atmosphere, written by some 17 co-authors led by Peter O’Neill, Ronan Connolly, Michael Connolly, and Willy Soon. The title is “Evaluation of the Homogenization Adjustments Applied to European Temperature Records in the Global Historical Climatology Network Dataset.” The main difference between this piece and Kirye’s 2021 work is that whereas Kirye only attempted to tackle temperature alterations at 6 weather stations, these guys have collected some ten plus years of both adjusted and unadjusted NCEI data from every station in Europe, close to 4000 stations in total. They then attempt to some degree to reverse-engineer the adjustments to figure out what NCEI is doing, and particularly whether NCEI is validly identifying station discontinuities, such as moves or instrumentation changes, that might give rise to valid adjustments. The bottom line is that the adjusters make no attempt to tie adjustments to any specific event that would give rise to legitimate homogenization, and that many of the alterations appear ridiculous and completely beyond justification.
Before getting to the specifics of the work of O’Neill et al., we should look first briefly at the end product that NCEI puts out, and how they attempt to use that product. As one example of the hockey stick form of the data as presented by NCEI, here is one of several NCEI presentations of global temperature data from 1880 through the most recent month of January 2022:
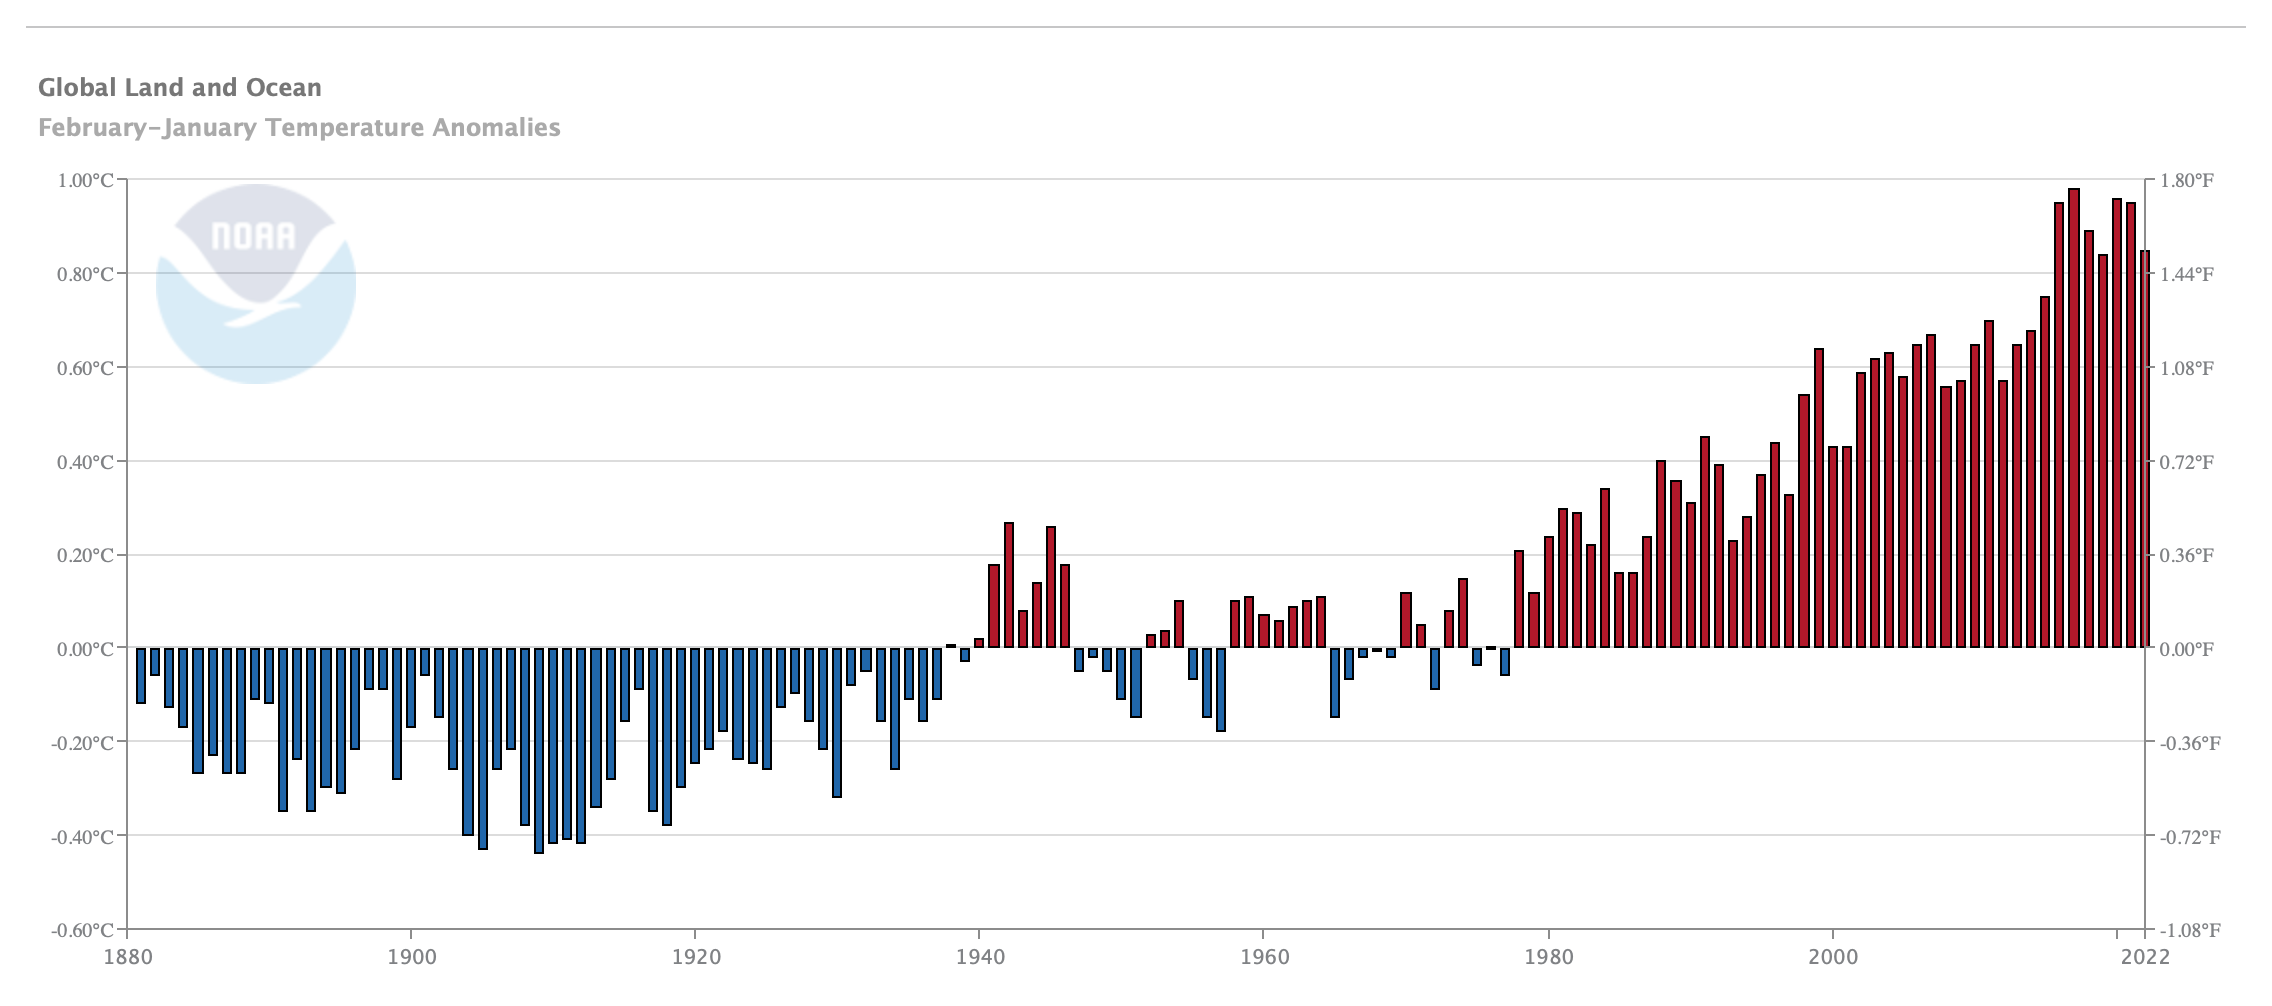
NCEI always makes a point of accompanying its scary graphs with text emphasizing what appears to be a rapid ongoing increase in temperatures. For example, here is some text from the latest update:
January 2022. The global surface temperature for January 2022 was 0.89°C (1.60°F) above the 20th century average and the sixth highest for January since global records began in 1880. The last eight Januarys (2015–2022) rank among the 10 warmest Januarys on record. January 2022 also marked the 46th consecutive January and the 445th consecutive month with temperatures, at least nominally, above average.
But then there is this admission:
NOAAGlobalTempv5 is a reconstructed dataset, meaning that the entire period of record is recalculated each month with new data. Based on those new calculations, the new historical data can bring about updates to previously reported values. These factors, together, mean that calculations from the past may be superseded by the most recent data and can affect the numbers reported in the monthly climate reports.
Yes, “calculations from the past may be superseded by the most recent data.” Huh?
Dig into O’Neill et al., and you find out just how ridiculous this can become. You might think that the right way to do “homogenization” adjustments would be to gather data systematically on station changes that might affect each station’s temperature reporting (for example, station moves or instrumentation changes), then determine a constant figure for how much that particular change affects the results from this station, and then use that constant amount to adjust the reporting going forward.
But no, that is not how it is done at all. As reported in O’Neill et al., at least in Europe NCEI makes no attempt to collect so-called station “metadata” on such things as station moves, instrumentation changes, or the like. Instead, the geniuses back at the home office have written a computer program, known as the “Pairwise Homogenization Algorithm” (PHA) that supposedly identifies station “discontinuities” by means of some sort of statistical legerdemain. The PHA then deems some of these to be “breakpoints” in data reporting that require homogenization adjustments to be applied. But they run the program every day, and every day it identifies different breakpoints and applies different homogenization adjustments, with no ability to tie the adjustments to any particular physical attribute of the station at all. From the Abstract:
A remarkable inconsistency in the identified breakpoints (and hence adjustments applied) was revealed. Of the adjustments applied for GHCN Version 4, 64% (61% for Version 3) were identified on less than 25% of runs, while only 16% of the adjustments (21% for Version 3) were identified consistently for more than 75% of the runs. . . . [M]any of the PHA adjustments applied to the homogenized GHCN dataset may have been spurious.
That’s certainly putting it gently. Get into the body of the paper, and they consider the cases of several particular stations. For example, here is some information about the station at Valencia Observatory, Ireland:
None of the breakpoints identified by NOAA’s PHA for any of those updates corresponded to any of the four documented events in the station history metadata which the Valentia Observatory observers provided; . . .The PHA homogenization failed to identify, in any of those updates, non-climatic biases associated with the major station move in 1892 or the second station move in 2001 for which parallel measurements showed a −0.3 ◦C cooling bias.
In short, the supposed “homogenization” adjustments for this station were completely unrelated to anything you might think would be associated with legitimate reasons for homogenization. Or consider this discovery for the station at Cheb, Czech Republic:
It can be seen that this metric [net temperature adjustment] changes quite erratically from day to day. This is a surprising result to us. We might have expected some occasional variations in the exact adjustments applied to a given station over the years, e.g., due to changes in the stations used as neighbors and monthly updates to the most recent temperature values. However, we would have still expected that the homogenization adjustments calculated by the PHA for any given station should remain fairly similar every time the algorithm is re-run.
The more the authors looked, the less they found any relationship at all between valid station discontinuities and temperature adjustments inserted by NCEI’s computer algorithm:
Only 3% of the PHA breakpoints for either version corresponded exactly (to the nearest month) to documented events. . . . [E]ven if we consider those breakpoints identified by the PHA within 12 months of the documented event, the matches are disappointedly low: only 18% for Version 3 and 19% for Version 4.
O’Neill et al. are extremely gentle in the words they use to describe and criticize the data alterations taking place. (E.G., “[W]e believe these findings should be used as motivation for improving our approaches to homogenizing the available temperature records.”). The main conclusion is somewhat more strongly stated:
[T]he results raise serious concerns over the reliability of the homogenized versions of the GHCN dataset, and more broadly over the PHA techniques, which do not appear to have been appreciated until now. As shown in Table 1, the homogenized GHCN datasets have been widely used by the community for studying global temperature trends.
Let me state it a little more strongly. The findings of O’Neill et al. completely undermine any assertion that NCEI/NOAA’s homogenized temperature series, to the extent derived from European data, are a valid representation of temperature trends over the period covered. Bureaucrats with a clear interest in a particular result are allowed to “adjust” the data to get the result they want, and to obscure the methodology of the data alterations to such a degree as to make it almost impossible for any outsider to penetrate the fog and evaluate the validity of the adjustments. Congratulations to O’Neill et al. on a massive data collection project that has exposed at least a part of these completely crooked data alterations.