Continuing Manipulation Of Poverty Statistics
/As I have written many times, I don’t think that the federal measure of “poverty” in the United States was originally created with fraudulent intent to deceive the voters. However, as the measure of poverty has evolved over the years, the thing deemed “poverty” by the statistics no longer bears any meaningful resemblance to what normal people think of as poverty. Rather than measuring anything that might resemble actual physical deprivation, the statistics have evolved into an artifact to manipulate the voters. In a post about a year ago I described what I call the “poverty scam” as follows:
[T]he government cynically manipulates the poverty statistics so that the official measured rate of poverty never goes meaningfully down, no matter how much taxpayer money is spent, thus manufacturing a fake basis to hit up the people for ever increasing funding at regular intervals.
Over the past week or so we have just been treated to the umpteenth iteration of this poverty scam.
On September 12 the Census Bureau put out a press release announcing its latest income and poverty data, covering the year 2022. The New York Times covered the release with a big piece the same day: “Poverty Rate Soared in 2022 as Aid Ended and Prices Rose.” From the Times:
The poverty rate rose to 12.4 percent in 2022 from 7.8 percent in 2021, the largest one-year jump on record, the Census Bureau said Tuesday. Poverty among children more than doubled, to 12.4 percent, from a record low of 5.2 percent the year before. Those figures are according to the Supplemental Poverty Measure. . . .
Now, an increase in the poverty rate from 7.8% to 12.4% in one year sounds like a huge jump — more than 50% in terms of the number of people deemed to be living “in poverty.” How could that have happened in a year which had seemed to be a year of recovery from the pandemic, and with an apparently tight labor market? According to the Times, the key factor was the ending of government aid programs, specifically those related to the Covid pandemic:
[S]afety net programs that were created or expanded during the pandemic. . . included a series of direct payments to households in 2020 and 2021, enhanced unemployment and nutrition benefits, increased rental assistance and an expanded child tax credit, which briefly provided a guaranteed income to families with children. Nearly all of those programs had expired by last year, however. . . .
But the expenditures the Times lists were never intended as anti-poverty measures. What happened to actual anti-poverty spending between 2021 and 2022? As far as I can determine, it did not go down, but rather went up, and not by a little. According to a Cato Institute study here, federal anti-poverty spending in 2021 was approximately $1.1 trillion; and according to a House Budget Committee release here from March 15, 2023, federal spending on its welfare and anti-poverty programs for fiscal 2022 (ending on September 30, 2022) was approximately $1.19 trillion. In other words, there was an increase of close to $100 billion, or over 8%.
So can we get to the bottom of what is going on here? Note that in the Times article they specifically state that the increase in the poverty rate is as measured by something called the “Supplemental Poverty Rate.” That’s the New Coke poverty rate created during the Obama administration to introduce a definition of “poverty” as something no longer absolute, but rather relative to median income, and that therefore would be resistant to ever decreasing no matter how much the incomes of low income people might rise. So what happened in the same year to poverty as measured by the so-called “official” poverty rate (based, supposedly, on an absolute measure of poverty)? Read deeper into the Times piece — like, fifteen paragraphs deeper — and you get this:
The “official” poverty rate — an older measure that is widely considered outdated because it excludes many of the government’s most important anti-poverty programs, among other shortcomings — was nearly flat last year, at 11.5 percent, . . . By that measure, the poverty rate for Black Americans was 17.1 percent, the lowest rate on record.
In other words, this Official Poverty Rate isn’t useful for our purposes in this round, so we will emphasize the other one. A chart accompanying the article shows that the measure of the “official” poverty rate did not budge between 2021 and 2022, despite the large changes in funding including expiration of Covid-related programs and increases in anti-poverty programs:
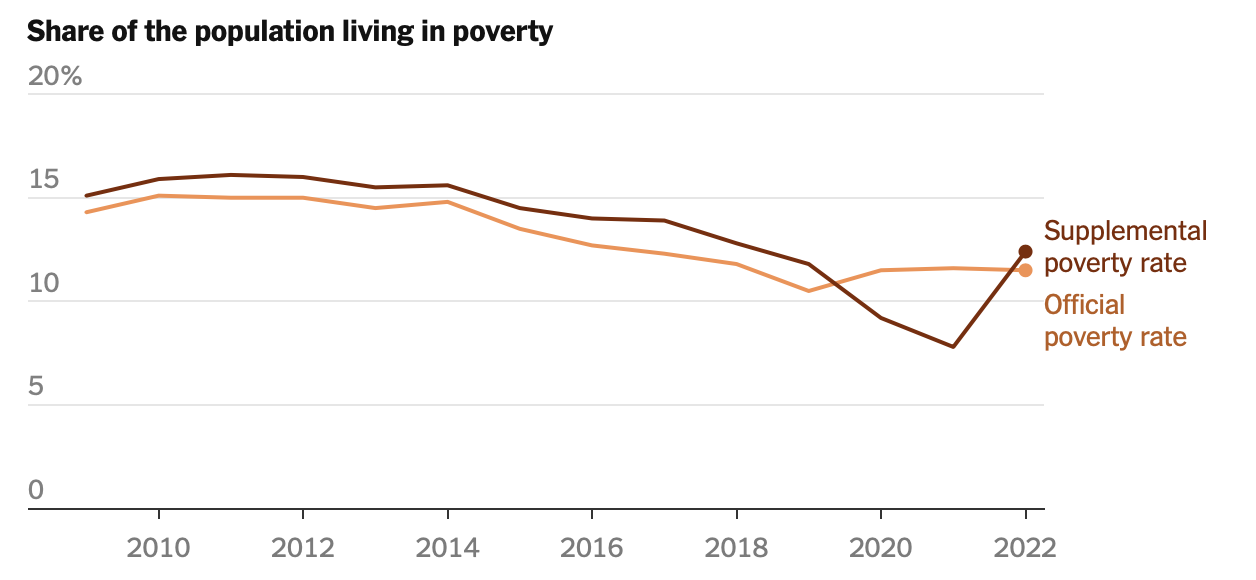
Now that the Supplemental Poverty Rate has bounced back to be slightly above the Official Poverty Rate, it looks like the natural order of the government poverty statistics has been restored. $1.2 trillion or more of federal anti-poverty spending every year, and the poverty rate, by either measure, just stays right around the same 12% or so. And so the stage is set for the next round of advocacy for increased spending to alleviate poverty, none of which will ever bring the measured rate down meaningfully for any period of time.