Important New Report Explores The Futility Of Wind Power
/A reader named Bill Ponton has just produced an important new Report that explores the effects and costs of continuing increases in generation of electricity from wind. The Report has the title “The Cost of Increasing UK Wind Power Capacity: A Reality Check.”
Ponton’s Report follows and builds on prior work of Roger Andrews and Ken Gregory that has previously been featured at this site. The idea of each of these researchers has been to use publicly available data from some jurisdiction as to electricity consumption, and as to electricity generation from each source — natural gas, nuclear, wind, solar, coal, hydro, etc. — to build a spreadsheet that can then be manipulated to investigate what happens on changing various assumptions going forward. In 2018, Andrews performed such an exercise for California and Germany, using daily data from 2016 and 2017. In 2021, Gregory performed a similar exercise for the lower 48 U.S. states, this time using hourly data from 2019 and 2020. Ponton’s Report is now based on data from the UK from 2022, this time at 2.5 minute intervals throughout the year.
Also in the tradition of Andrews and Gregory, Ponton is an unpaid amateur, doing this important work on his own time for the benefit of humanity. It is truly incredible that, with the vast amounts of government funding available in this area, nobody gets paid for the most important investigations, which are to look into whether the proposed energy system of the future might actually work, and at what cost.
The heart of Ponton’s Report is the first part, headed “Energy Generation and Power Capacity.” Here, Ponton investigates what happens when the amount of wind power generation in the UK is doubled, tripled and quadrupled from the current level. This investigation is highly significant, because renewable power advocates repeat endlessly that all that is needed to replace fossil fuels is the political will to build enough renewable generation capacity, and that generation from wind (and solar) are actually cheaper today than generation from fossil fuels. But then, wind power is intermittent. Does that fact undermine the claims that wind (or solar) can fully replace fossil fuels in electricity generation, and at lower cost? How does vastly increasing the generation from wind play out in the real world?
Ponton begins by laying out the baseline of electricity generation in the UK for 2022:
In 2022, the UK derived: 24% of its electric energy from wind generation, 43% from gas turbine generation and 33% from other sources such as coal, nuclear, hydro and biomass. . . . The UK currently has 28 GW wind power capacity, 14 GW of onshore and 14 GW of offshore, with the potential to generate 245,280 GWH per year [3]. It actually generated 61,631 GWH in wind energy in 2022 or approximately 25% of the total wind power capacity.
Ponton’s Figure 1 shows the actual pattern of electricity generation by source for 2022:
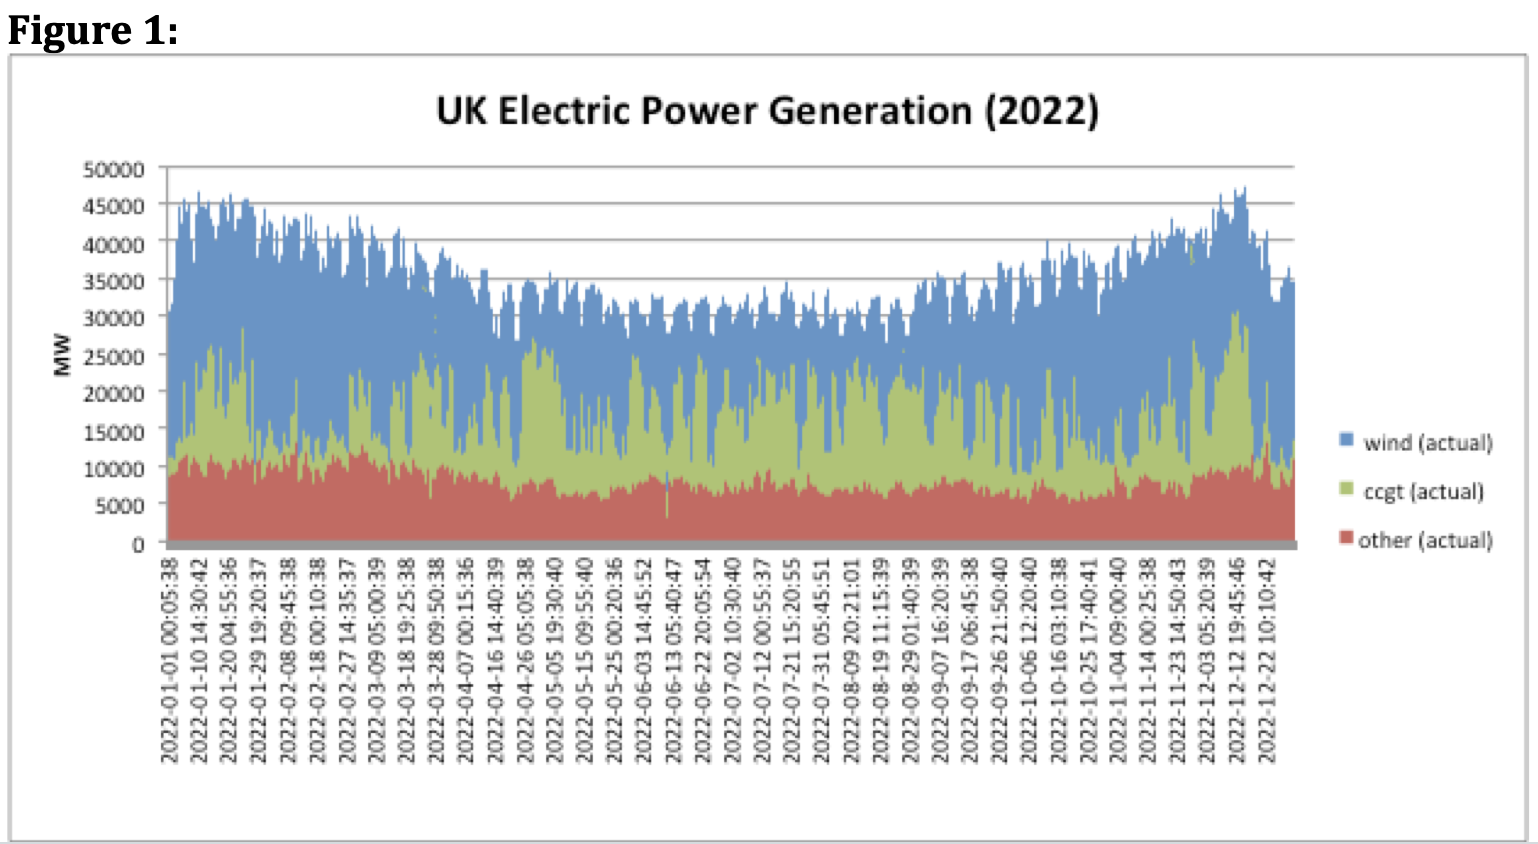
Demand varies from a low of about 25 GW to a high of just over 45 GW. The “other” category of generation stays fairly constant throughout the year, in the range of about 7 GW to 11 GW. But wind generation varies wildly, from a high of the full 28 GW down to as little as about 2 GW, depending on whether or not the wind is blowing. And the generation from natural gas swings just as wildly, following the swings of the wind.
OK then, what happens when the generation from wind is doubled at each data point? And the answer is that the cost of the wind-generated electricity doubles, but the amount of useful electricity produced is far less than doubled, because now much of the generation comes at times when production exceeds customer demand, and therefore the excess must be “curtailed.” Ponton:
I start by doubling the value of wind power generation at each observation point in the 2022 GridWatch dataset. It results in total wind generation of 123,311 GWH per year. Conversely, I reduced gas turbine power generation at each interval by the amount required to keep the new sum of wind and gas turbine power generation equal to the original sum. However, at intervals where a doubling of wind power exceeds the original sum, wind power should be limited to the value of the original sum. In addition, gas turbine power generation must not fall below 1,373 MW. I impose this constraint because it is the minimum level of gas turbine generation observed over every period in 2022. Both these constraints result in a curtailment of wind energy generation of 18,505 GWH, or 15% of the total wind energy generated, and useful wind energy generation of 104,805 GWH, or 40% of the total energy provided to the grid.
So doubling of wind generation capacity does not take the percent of UK electricity from wind from 24% to 48%, but only to 40%. The remaining 8% gets discarded because it is produced at times when it cannot be used.
Here is Ponton’s graph of what the generation mix looks like after doubling of wind capacity:

The chart shows much more blue (wind) and less green (natural gas), but the natural gas generation capacity is still fully needed from time to time, such as what appears to have been a wind drought in late April and early May.
And then, it’s just what you would expect after that. Each addition of another chunk of wind generation capacity equal to the current total of 28 GW adds the same increment of cost, but provides less and less useful electricity, because more and more comes at times when it cannot be used and must be curtailed. Ponton:
With tripling, I obtained curtailment of wind energy generation of 59,851 GWH, or 32% of the total wind energy generated, and useful wind energy generation of 125,114 GWH, or 48% of the total energy provided to the grid. With quadrupling, I obtained curtailment of wind energy generation of 110,088 GWH, or 45% of the total wind energy generated, and useful wind energy generation of 136,532 GWH, or 52% of the total energy provided to the grid.
Meanwhile, the natural gas backup gets used less and less, but none of it can be eliminated, because all of it could be needed at any time. It must remain fully maintained, fully staffed, and fully fueled.
Ponton has made a significant contribution to the discussion by producing a graph showing the pattern of increases of useful electricity from wind as wind generation increases by additional multiples. Here it is:

The percent of generation from wind approaches a limit asymptotically. The particular limit (53% of total annual electricity generation in this graph) is driven by assumptions in the spreadsheet. The most important ones here are that the generation from the “other” sources does not change from 2022 actual figures, and that the generation from natural gas will not go below 1.373 GW (which was the lowest natural gas output at any data point in 2022). However, if those assumptions are eliminated, and wind is commissioned to replace everything to the extent it is capable of doing so, it is apparent that the percentage of electricity generated from wind will still experience rapidly slowing increases as more wind capacity is added, and will approach a limit asymptotically. This means that each incremental addition of wind generation capacity produces electricity that is more and more costly, with the costs accelerating rapidly after the tripling of existing capacity.
Ponton’s Report goes on to consider additional issues, such as various cost considerations, as well as potentially using energy storage to address the problem of overproduction and curtailment. I will delve into those things in future posts.
UPDATE, April 2: Mr. Ponton provides this link to his spreadsheets for those who might want to check his work.
UPDATE, April 3: Several commenters have pointed out that in the color charts showing generation from the various sources, the percent of wind power appears to the eye to be higher than the calculated percentages. Mr. Ponton has looked into this, and the reason appears to be that the resolution of the charts in his draft report was insufficient to show many spikes of natural gas generation that occur during brief periods of calm. Therefore, Mr. Ponton has updated the Report to include higher resolution charts. Here is the link to the updated Report. And here is what the new Figure 2 (Wind Power Capacity x2) looks like in the new version:
